Vega Chart widget
Charting widget based on Vega declarative visualization language.
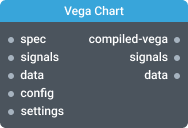
In-ports
spec JSON — The chart configuration as Vega or Vega-Lite JSON.
signals JSON — Dynamic variables that drive interactive updates.
data Array|Object|String — The data for chart.
spec-config JSON — The Vega configuration object.
config JSON — The widget settings object.
Out-ports
on-state-change Object - Chart signal or data value change.
Overview
Vega Chart widget can render a wide variety of data visualizations. The visualizations are configurable using Vega or Vega-Lite JSON specification. To create a visualization, pass Vega or Vega-Lite specification to spec input and then connect your data source to the data input.
Vega-Lite example
The following is an example of a simple bar chart Vega-Lite spec.
Vega-Lite bar chart spec
{
    "$schema": "https://vega.github.io/schema/vega-lite/v4.json",
    "description": "A simple bar chart with embedded data.",
    "data": {
        "values": [
            { "a": "A", "b": 28 },
            { "a": "B", "b": 55 },
            { "a": "C", "b": 43 },
            { "a": "D", "b": 91 },
            { "a": "E", "b": 81 },
            { "a": "F", "b": 53 },
            { "a": "G", "b": 19 },
            { "a": "H", "b": 87 },
            { "a": "I", "b": 52 }
        ]
    },
    "mark": "bar",
    "encoding": {
        "x": { "field": "a", "type": "nominal", "axis": { "labelAngle": 0 } },
        "y": { "field": "b", "type": "quantitative" }
    }
}
Vega example
The following is an example of a simple bar chart Vega spec.
Vega bar chart spec
{
    "$schema": "https://vega.github.io/schema/vega/v5.json",
    "data": [
        {
            "name": "table",
            "values": [
                {
                    "category": "A",
                    "amount": 28
                },
                {
                    "category": "B",
                    "amount": 5
                },
                {
                    "category": "C",
                    "amount": 43
                }
            ]
        }
    ],
    "scales": [
        {
            "name": "xscale",
            "type": "band",
            "domain": {
                "data": "table",
                "field": "category"
            },
            "range": "width",
            "padding": 0.05,
            "round": true
        },
        {
            "name": "yscale",
            "domain": {
                "data": "table",
                "field": "amount"
            },
            "nice": true,
            "range": "height"
        }
    ],
    "axes": [
        {
            "orient": "bottom",
            "scale": "xscale"
        },
        {
            "orient": "left",
            "scale": "yscale"
        }
    ],
    "marks": [
        {
            "type": "rect",
            "from": {
                "data": "table"
            },
            "encode": {
                "enter": {
                    "x": {
                        "scale": "xscale",
                        "field": "category"
                    },
                    "width": {
                        "scale": "xscale",
                        "band": 1
                    },
                    "y": {
                        "scale": "yscale",
                        "field": "amount"
                    },
                    "y2": {
                        "scale": "yscale",
                        "value": 0
                    }
                },
                "update": {
                    "fill": {
                        "value": "steelblue"
                    },
                    "stroke": {
                        "value": "none"
                    }
                }
            }
        }
    ]
}
Signals
Vega Chart also supports Vega signals - the dynamic variables that drive interactive updates. You need to explicitly specify which signals Vega Chart will be listening to in widget Settings dialog. You can set/update signal value by sending signal value event to signals input.
{
    "value": 3.14,
    "name": "metric"
}
Any change of the value for configured signals will trigger an event on signals output.
ⓘ NOTE
Vega signals are different from Kelp signals. For clarity, consider Vega signals as dynamic variables inside Vega Chart.
Data
Vega specification supports data embedded into the specification itself. If you pass the configuration that includes the data in the spec, then leave the data input free. Otherwise the data in the spec will be overwritten.
In cases when specification contains only one data entry with format json or csv data input accepts data "as is" (let's call it "anonymous data"), no additional transformations required, see examples below.
ⓘ NOTE
When using anonymous data keep in mind that the widget stores the value, and will try to apply it after spec compilation, i.e. when you'll change spec after providing anonymous data and if spec contains only one entry in
datasection,the widget will try to apply the data.If it undesired behaviour, you should send
RESETsignal (Kelp signal) to data input before updating spec, or you can enable Reset datasets on spec update option in widget settings.
Example for Vega-Lite
The following is an examples of a simple bar chart with Vega-Lite and spec/data separately.
Note, for cases when spec depends on one data entry, data section of spec can be absent.
With anonymous data entry
Vega-Lite bar chart spec (anonymous data entry)
{
    "$schema": "https://vega.github.io/schema/vega-lite/v4.json",
    "description": "A simple bar chart with embedded data.",
    "mark": "bar",
    "encoding": {
        "x": { "field": "a", "type": "nominal", "axis": { "labelAngle": 0 } },
        "y": { "field": "b", "type": "quantitative" }
    }
}
Vega-Lite bar chart data
[
    { "a": "A", "b": 28 },
    { "a": "B", "b": 55 },
    { "a": "C", "b": 43 },
    { "a": "D", "b": 91 },
    { "a": "E", "b": 81 },
    { "a": "F", "b": 53 },
    { "a": "G", "b": 19 },
    { "a": "H", "b": 87 },
    { "a": "I", "b": 52 }
]
With named data entry
Vega-Lite bar chart spec (named data entry)
{
    "$schema": "https://vega.github.io/schema/vega-lite/v4.json",
    "description": "A simple bar chart with embedded data.",
    "data": {
        "name": "source_data_entry_name"
    },
    "mark": "bar",
    "encoding": {
        "x": { "field": "a", "type": "nominal", "axis": { "labelAngle": 0 } },
        "y": { "field": "b", "type": "quantitative" }
    }
}
Vega-Lite bar chart data
[
    {
        "name": "source_data_entry_name",
        "values": [
            { "a": "A", "b": 28 },
            { "a": "B", "b": 55 },
            { "a": "C", "b": 43 },
            { "a": "D", "b": 91 },
            { "a": "E", "b": 81 },
            { "a": "F", "b": 53 },
            { "a": "G", "b": 19 },
            { "a": "H", "b": 87 },
            { "a": "I", "b": 52 }
        ]
    }
]
Example for Vega
The following is an example of a simple bar chart with Vega and spec/data separately.
Vega bar chart spec
{
    "$schema": "https://vega.github.io/schema/vega/v5.json",
    "data": [
        {
            "name": "table"
        }
    ],
    "scales": [
        {
            "name": "xscale",
            "type": "band",
            "domain": {
                "data": "table",
                "field": "category"
            },
            "range": "width",
            "padding": 0.05,
            "round": true
        },
        {
            "name": "yscale",
            "domain": {
                "data": "table",
                "field": "amount"
            },
            "nice": true,
            "range": "height"
        }
    ],
    "axes": [
        {
            "orient": "bottom",
            "scale": "xscale"
        },
        {
            "orient": "left",
            "scale": "yscale"
        }
    ],
    "marks": [
        {
            "type": "rect",
            "from": {
                "data": "table"
            },
            "encode": {
                "enter": {
                    "x": {
                        "scale": "xscale",
                        "field": "category"
                    },
                    "width": {
                        "scale": "xscale",
                        "band": 1
                    },
                    "y": {
                        "scale": "yscale",
                        "field": "amount"
                    },
                    "y2": {
                        "scale": "yscale",
                        "value": 0
                    }
                },
                "update": {
                    "fill": {
                        "value": "steelblue"
                    },
                    "stroke": {
                        "value": "none"
                    }
                }
            }
        }
    ]
}
Vega bar chart data (anonymous data entry)
[
    {
        "category": "A",
        "amount": 28
    },
    {
        "category": "B",
        "amount": 5
    },
    {
        "category": "C",
        "amount": 43
    }
]
Vega bar chart data (named data entry)
[
    {
        "name": "table",
        "values": [
            {
                "category": "A",
                "amount": 28
            },
            {
                "category": "B",
                "amount": 5
            },
            {
                "category": "C",
                "amount": 43
            }
        ]
    }
]
Details about data input
data input accepts the following format, the same for Vega and Vega-Lite spec:
[
    {
        "name": "data_entry_name",
        "values": [
            { "a": "A", "b": 28 },
            { "a": "B", "b": 55 },
            { "a": "C", "b": 43 }
        ]
    }
]
Array of object with name and values fields.
format field also can be added to the data entry as well.
More info about format available at Vega documentation.
ⓘ NOTE
Data input objects may contain only
nameandvaluesfields,formatfields.Other fields (such as
source,onandtransform) must be mentioned in specification.
[
    {
        "name": "csv_example_data_entry_name",
        "values": "a\n1\n2\n3\n4",
        "format": {
            "type": "csv"
        }
    }
]
ⓘ NOTE
If you want to send spec and data separately specification must contain at least name of data entry.
for Vega-Lite:
{
    "$schema": "https://vega.github.io/schema/vega-lite/v4.json",
    "data": {
        "name": "data_entry_name"
    }
}
or (when more than one data entry required)
{
    "$schema": "https://vega.github.io/schema/vega-lite/v4.json",
    "layer": [
        {
            "data": { "name": "data_entry_name_1" }
        },
        {
            "data": { "name": "data_entry_name_2" }
        }
    ]
}
for Vega:
{
    "$schema": "https://vega.github.io/schema/vega/v5.json",
    "data": [
        {
            "name": "data_entry_name_1"
        },
        {
            "name": "data_entry_name_2"
        }
    ]
}
Signals binding
Vega allows to bind a signal to an input element defined outside of the visualization.
But In Kelp binding signals can be implemented other way - connect signal input and output with any widget (form or card, for example).
Settings
Title
The title of the widget.
Output signals
Declare signals that Vega Chart widget will be listening too. It includes both input and output signals. Click on "+" to add one or more signals.
Output datasets
Declare datasets that Vega Chart widget will be listening too. It includes both input and output datasets. Click on "+" to add one or more datasets.
Reset signals on spec update
By default the widget store all signals values, if you'll change specification in runtime, the signals values will be applied.
Enable this flag if you want to drop signals state after specification update.
Reset datasets on spec update
By default the widget store all datasets values, if you'll change specification in runtime, the datasets values will be applied.
Enable this flag if you want to drop datasets state after specification update.
Renderer
The type of renderer to use (canvas or svg).
Scrollbar
Controls the visibility of scrollbars, in cases when visualization size bigger than widget tile, possible values:
No scrollbars- (default) do not show scrollbarsBoth scrollbars- show vertical and horizontal scrollbarsVertical only- show vertical scrollbar onlyHorizontal only- show vertical horizontal only
Inherit dimensions from widget's container
By default chart width/height and autosize parameters are defined in spec.
If enabled the following fitting options will be available:
Fill- (default) stretch if aspect ratio does not matchContain- fit without clipping and maintain aspect ratioCover- fit with clipping and maintain aspect ratioFit to width- fit to container width and maintain aspect ratioFit to height- fit to container height and maintain aspect ratio
Hide progress bar
Controls the visibility of widget progress bar. By default, widget progress bar is visible.
Hide help icon
Controls the visibility of help icon. By default, help icon is visible.