Vega Chart widget
Charting widget based on Vega declarative visualization language.
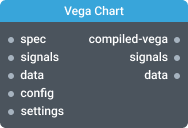
In-ports
spec JSON — Vega or Vega-Lite JSON chart specification.
signals JSON — Vega signals that drive interactive chart updates.
data Array — The data for chart.
Out-ports
signals Object — Vega signals and selections.
Overview
Vega Chart widget can render a wide variety of data visualizations. The visualizations are configurable using Vega JSON specification. To create a visualization, pass Vega specification to spec input and then connect your data source to the data input.
Vega specification supports data embedded into the specification itself. If you pass the configuration that includes the data in the spec, then leave the data input free. Otherwise the data in the spec will be overwritten.
Vega Chart also supports Vega signals - the dynamic variables that drive interactive updates. You need to explicitly specify which signals Vega Chart will be listening to in widget Settings dialog. You can set/update signal value by sending signal value event to signals input.
{
    "data": 3.14,
    "meta": {
        "type": "KELP_CHART_SIGNAL",
        "name": "metric"
    }
}
Any change of the value for configured signals will trigger an event on signals output.
ⓘ NOTE
Vega signals are different from Kelp signals. For clarity, consider Vega signals as dynamic variables inside Vega Chart.
The following is an example of a simple bar chart Vega spec.
Vega bar chart spec
{
    "$schema": "https://vega.github.io/schema/vega/v5.json",
    "data": [
        {
            "name": "table",
            "values": [
                {
                    "category": "A",
                    "amount": 28
                },
                {
                    "category": "B",
                    "amount": 5
                },
                {
                    "category": "C",
                    "amount": 43
                }
            ]
        }
    ],
    "scales": [
        {
            "name": "xscale",
            "type": "band",
            "domain": {
                "data": "table",
                "field": "category"
            },
            "range": "width",
            "padding": 0.05,
            "round": true
        },
        {
            "name": "yscale",
            "domain": {
                "data": "table",
                "field": "amount"
            },
            "nice": true,
            "range": "height"
        }
    ],
    "axes": [
        {
            "orient": "bottom",
            "scale": "xscale"
        },
        {
            "orient": "left",
            "scale": "yscale"
        }
    ],
    "marks": [
        {
            "type": "rect",
            "from": {
                "data": "table"
            },
            "encode": {
                "enter": {
                    "x": {
                        "scale": "xscale",
                        "field": "category"
                    },
                    "width": {
                        "scale": "xscale",
                        "band": 1
                    },
                    "y": {
                        "scale": "yscale",
                        "field": "amount"
                    },
                    "y2": {
                        "scale": "yscale",
                        "value": 0
                    }
                },
                "update": {
                    "fill": {
                        "value": "steelblue"
                    },
                    "stroke": {
                        "value": "none"
                    }
                }
            }
        }
    ]
}
Settings
Title
The title of the widget.
Signals
Declare signals that Vega Chart widget will be listening too. It includes both input and output signals. Click on "+" to add one or more signals.
Hide progress bar
Controls the visibility of widget progress bar. By default, widget progress bar is visible.
Hide help icon
Controls the visibility of help icon. By default, help icon is visible.