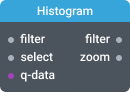
Histogram
A histogram is a visualization of the distribution of a numeric variable. It only takes numeric variables as input. The variable values are grouped into several bins, and the number of observations per bin is represented by the height of the bar.