Simple Weather App
This introductory tutorial guides you through building a simple weather app. You will learn how to connect an app to data source, inspect and transform data, and use interactive widgets to display the results. To follow along, you will need to sign in to Kelp and create a new app.
After completing this tutorial, you will be able to create more complex apps in Kelp and use various advanced features it provides.
Connect to data source
The first step is often deciding which data source to use. Among numerous of Kelp integrations you will find OpenWeather, which might be the best fit for building a weather app. That’s the one we are going to use.
Configure OpenWeather integration
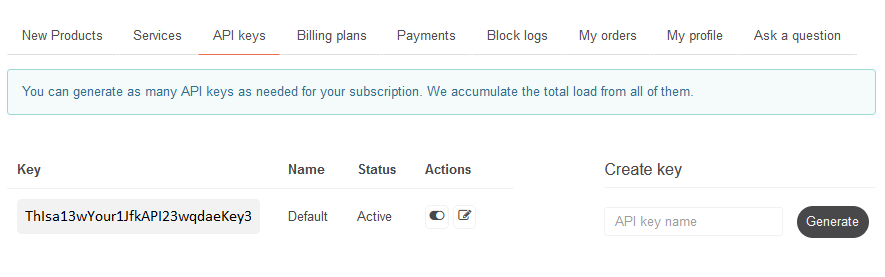
OpenWeather API is free to use and provides a 5 day forecast for any location on the globe. Before you can pull the data, you will need to create an OpenWeather account and get your API key. You can find it on the API keys tab.
Having the key at hand, navigate to your workspace in Kelp and configure the integration.
- Navigate to the Integrations page within your workspace.
- Click Add integration on the top right.
- Search for OpenWeather and select it.
- Enter your API key in the Key value field and click Submit.
OpenWeather integration can now be used in any app of this workspace.
Configure HTTP component
Now that the integration is configured, we can create an app and start defining app logic. As a first step, let’s add and configure an HTTP component that will make requests to OpenWeather API.
- Open the Apps page and then click New on the top right.
- Right click anywhere on the canvas to open the Components Library.
- Search for the HTTP component and place it on the canvas.
- Select the component and press spacebar to open its settings. Then, configure a new connection:
- Select OpenWeather from the list of integrations.
- Select your API key.
Next, we need to add components that will provide the base URL and query parameters to the HTTP component.
- Place the String and JSON components and connect them respectively to the url and params port of the HTTP component.
- Copy and paste the following URL into the String component.
https://api.openweathermap.org/data/2.5/forecast - Enter the following parameters into the JSON component. They are the name of the city and units of measurement. Feel free to change New York to whatever city you want.
{
"q": "New York",
"units": "metric"
 }
Inspect raw data
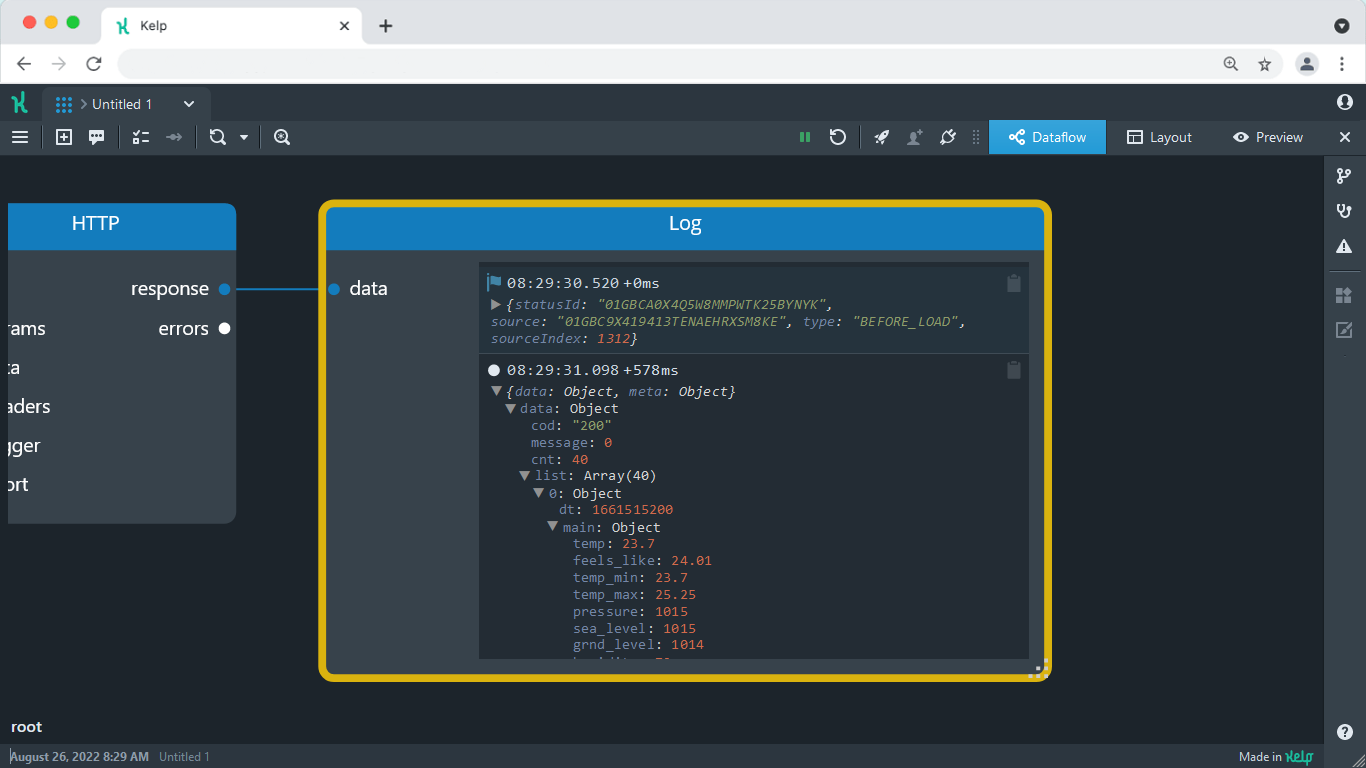
In Kelp, you can always get immediate visual feedback for the data you are working with. One of the ways to do this is through using a Log widget. It can display raw data sent to its input as is, without any changes.
- Place a Log widget on the canvas.
- Connect the response port of the HTTP component to the data port of the Log widget.
- Click Restart on the top bar.
Now, you can take a look inside the data object. As you expand it, you will notice that the elements in list are weather conditions reported every three hours. That’s exactly what we need.
Pass data to Table
Let’s display list in a more friendly, tabular format using a Table widget. To extract list from the entire response, we are going to use a simple KelpQL transformation.
- Move the Log widget out of the way, no need to disconnect it.
- Pull another wire out of the response port. On its end, the Port component will appear. As you will see later, having it here can save us some time and effort.
- Place the Table widget next to the Port component and connect them with a wire. On the widget side, use the data port.
- Select the first wire and press spacebar to open the transformation dialog.
- Select KelpQL from the dropdown. Then, enter the following transformation into the middle section:
This transformation reduces the entire response to
data.list | [*].merge(@, {"temp": main.temp})listand places nestedtempvalue one level up. The latter will aid us in configuring our Table.
Click the Restart button to restart the app and populate Table with the data.
Configure Table
At the moment there are seems to be too many columns in the table. To reduce their number let’s instruct Table to display only the Date and Temperature columns. We will have another widget to show a detailed forecast when one of the rows is selected.
-
Place the JSON component on the canvas.
-
Connect it to the config port of the Table widget.
-
Set the component’s value to the following JSON:
{
  "columns": [
    {
      "title": "Date",
      "key": "dt_txt",
      "width": 180
    },
    {
      "title": "Temperature",
      "key": "temp",
      "width": 140
    }
  ]
}
This configuration explicitly tells which of the columns we want to display. For these columns we edited the default titles, making them unabbreviated, as well as we changed their default width.
Display forecast for a certain day
When a table row gets selected, let’s have a more detailed forecast for this date displayed in a Metric Card widget.
- Place Metric Card on the canvas.
- Connect the selection port of the Table component to the data port of the Metric Card widget.
- Open the Settings dialog for the wire we just placed. Set its transformation to:
The
[0] || `[]` |
[
  {
    name: 'Temperature',
    value: main.temp,
    unit: '°C'
  },
  {
    name: 'Feels like',
    value: main.feels_like,
    unit: '°C'
  },
  {
    name: 'Humidity',
    value: main.humidity,
    unit: '%'
  },
  {
    name: 'Wind speed',
    value: wind.speed,
    unit: 'm/s'
  }
][0] || `[]`part here extracts the first element from the input array, or uses an empty array if nothing is received from the Table component. It is followed by an array of objects defining what is shown in Metric Card. Each object defines a name, value, and a unit of measurement.
Add a weather icon
Some information is easier to understand when it is put into a visual format. In our response we got the code of the weather icon and can now use it in our app. Additionally, we will add a short description which is also there in the response.
To get the icon, we will need to take the code and embed it in the following URL:
https://openweathermap.org/img/wn/{icon}
More specifically, to display an icon we need to pass this address to a Text widget replacing {icon} with the actual icon’s code.
- Place the Text widget on the canvas.
- Connect the selection port of the Table component to the text port of the Text widget.
- Select the wire you just placed and set its transformation to:
The above transformation uses the
template('
### {{weather[0].description}}',
[0] || `{}`)template()function to find the property in the input object and replace it with the property value. You may also note that Markdown syntax is used to assist with formatting. Text widgets supports Markdown and so it displays the result of the transformation as rich text.
Select current date by default
All right, we already have Metric Card and Text widget showing forecast on selection. However, when the application starts the date is not yet selected and these widgets remain empty. To avoid this, let’s make the current date be selected automatically.
- Disconnect the wire from the data port of the Table widget.
- Place Fork Stream to the left to the Table widget.
- Connect port 1 of the Fork Stream component to the data port of the Table widget.
- Connect port 2 of the Fork Stream component to the select port of the Table widget.
- Set the transformation of the second wire to:
This transformation extracts the first date in the forecast. The first element has the index 0 due to zero-based numbering. Then it is wrapped into an array with
[0] | [@][@]so it matches the type expected on the select port.
Add a forecast location
As a part of the API response we are also receiving the name of the city. It would be nice to display it too. The steps are similar to adding the weather icon.
- Place one more Text widget on the canvas.
- Connect the text port of the Text widget to the HTTP component’s response port.
- Select the wire you just placed and set its transformation to:
This transformation again uses the
template('# {{data.city.name}}',@)template()function and Markdown to format text. Namely, it extracts the name of the city and wraps it as a Markdown header.
Place widgets onto layout
Now that we are done with logic, let’s get to designing the app. This can be done by placing and positioning widgets on the Layout tab of the editor.
- Switch to the Layout tab.
- Click Widgets & views on the toolbar, to expand the Widgets panel. It contains all the widgets we have previously added to the graph.
- Drag the widgets onto the layout.
- Position and resize the widgets to your liking.
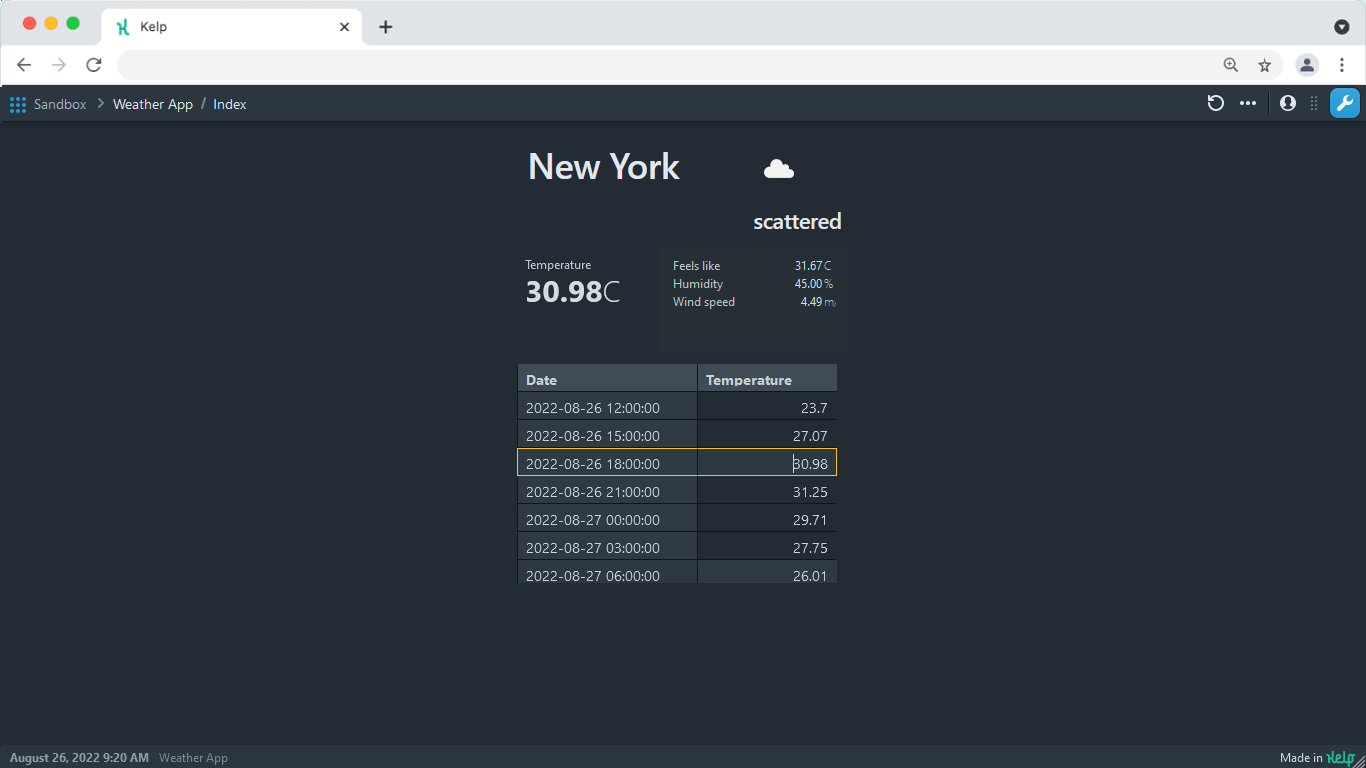
Once everything looks good, switch to the Preview tab to see what your final app looks like.
You have now built a weather app in Kelp from start to finish and learned Kelp basics along the way. Use what you have learned to make your own data-driven apps. Happy building!