Quickstart Guide
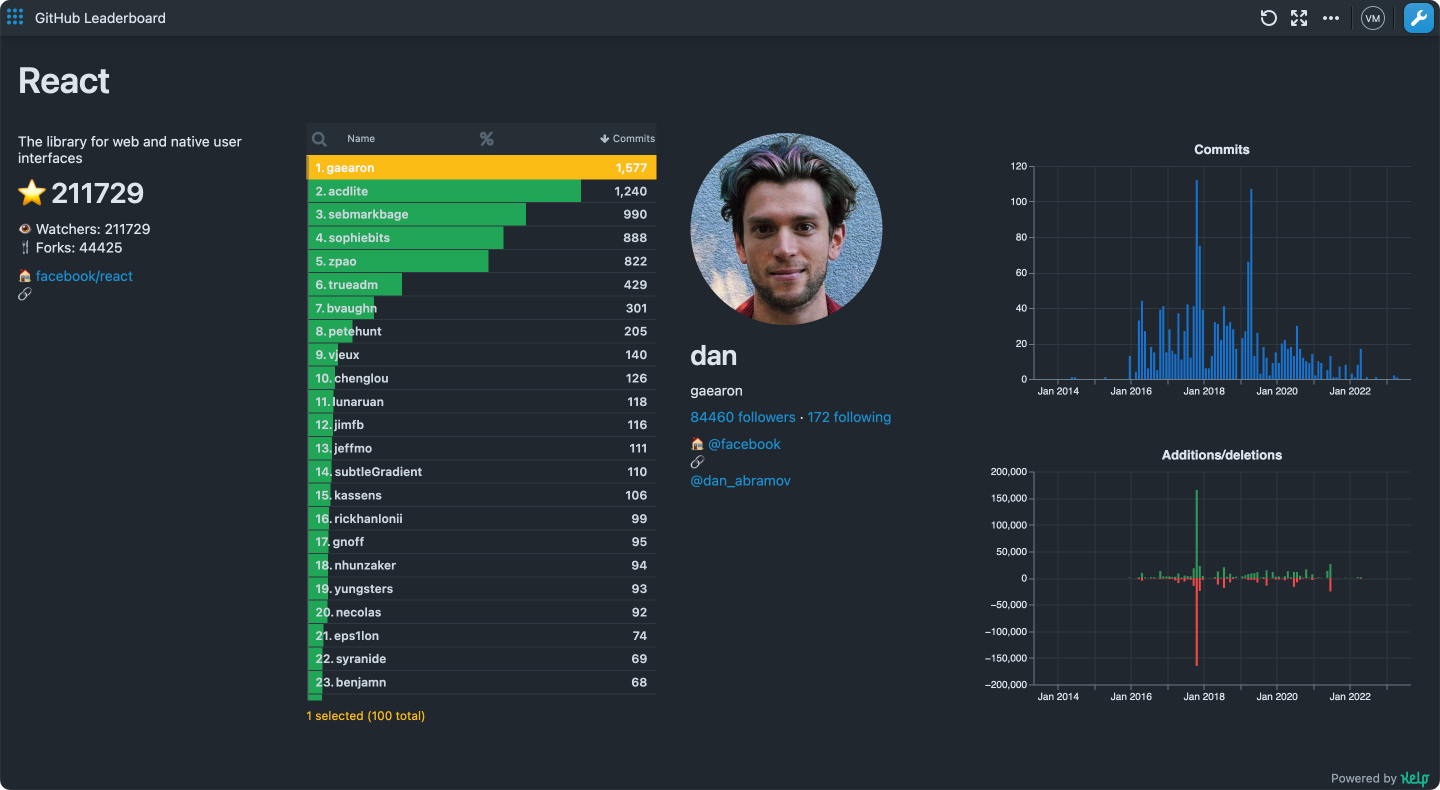
Kelp enables you to build interactive data applications quickly. This guide will take you through the steps of building a sample dashboard for a GitHub project contributors leaderboard. You will learn how to connect to data sources, inspect and transform data, and use interactive widgets to display the results. This tutorial is designed for anyone, and no prior technical knowledge is required.
Try out GitHub Leaderboard demo app to see it in action.
Before starting, sign in to Kelp and create a new app.
1. Connect to datasource
The first step in building any dashboard is to connect to the datasources and retrieve data. In this guide, we will use the GitHub REST API. This API provides details about GitHub projects and their contributors, and can be accessed without authentication.
Start by placing the HTTP component onto the canvas. You can use the Insert Component button from the menu or right-click anywhere on the Dataflow canvas.
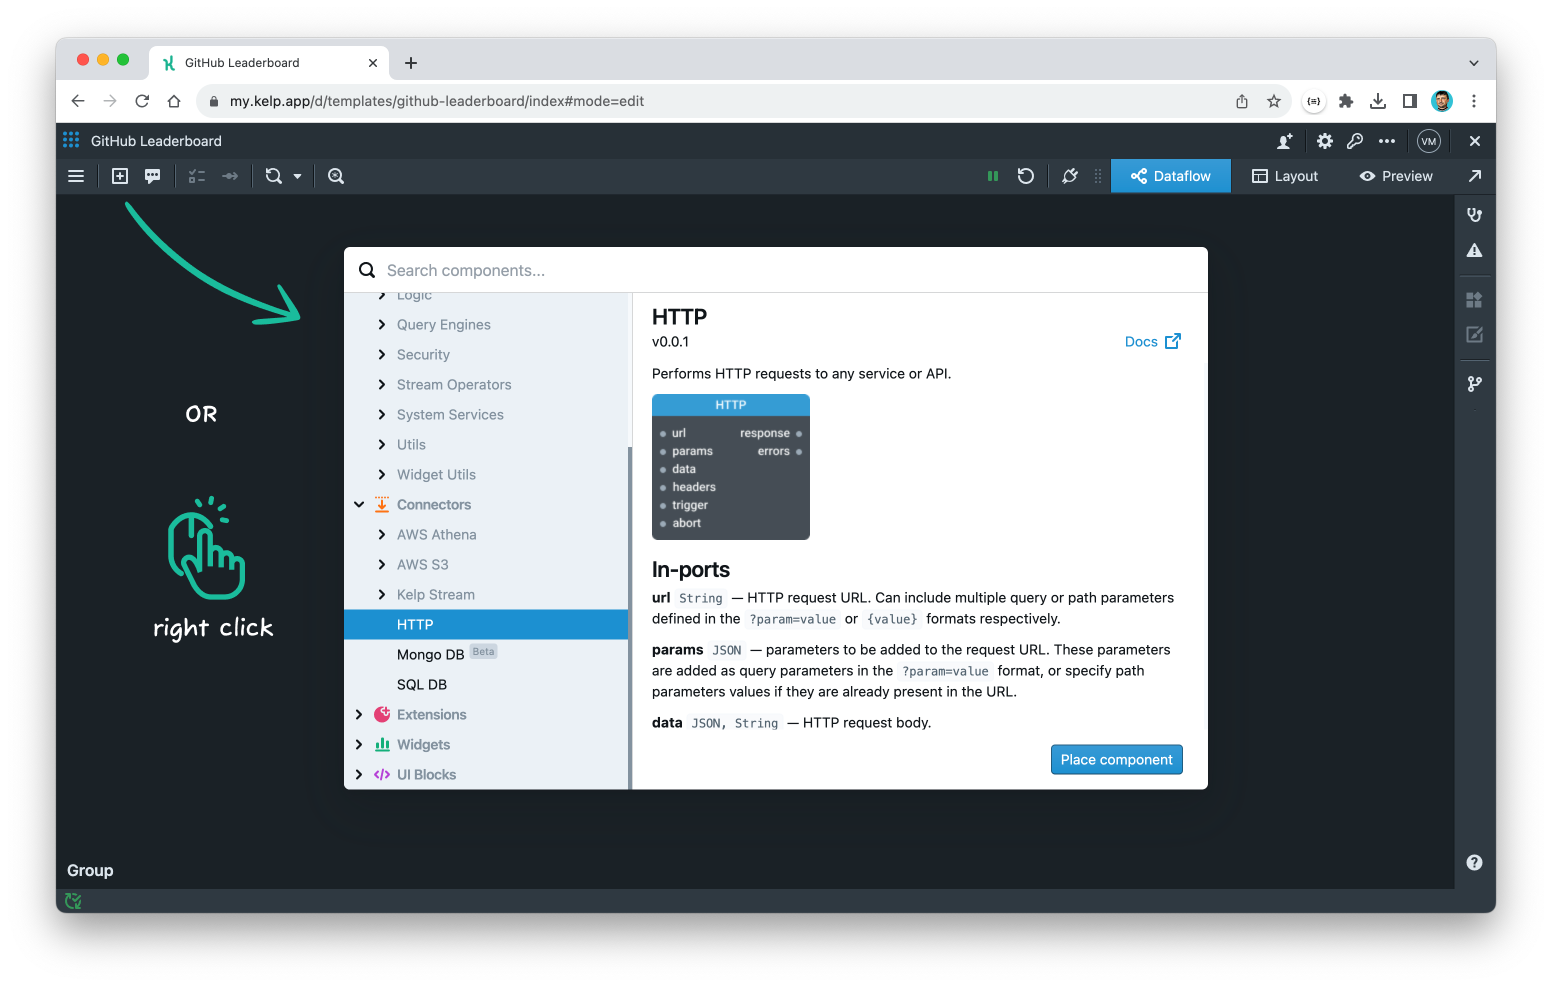
First, we will use the Get a repository API endpoint to retrieve general information about the repository, including the title, description, number of stars, and followers. This endpoint uses the GET method and does not require authentication.
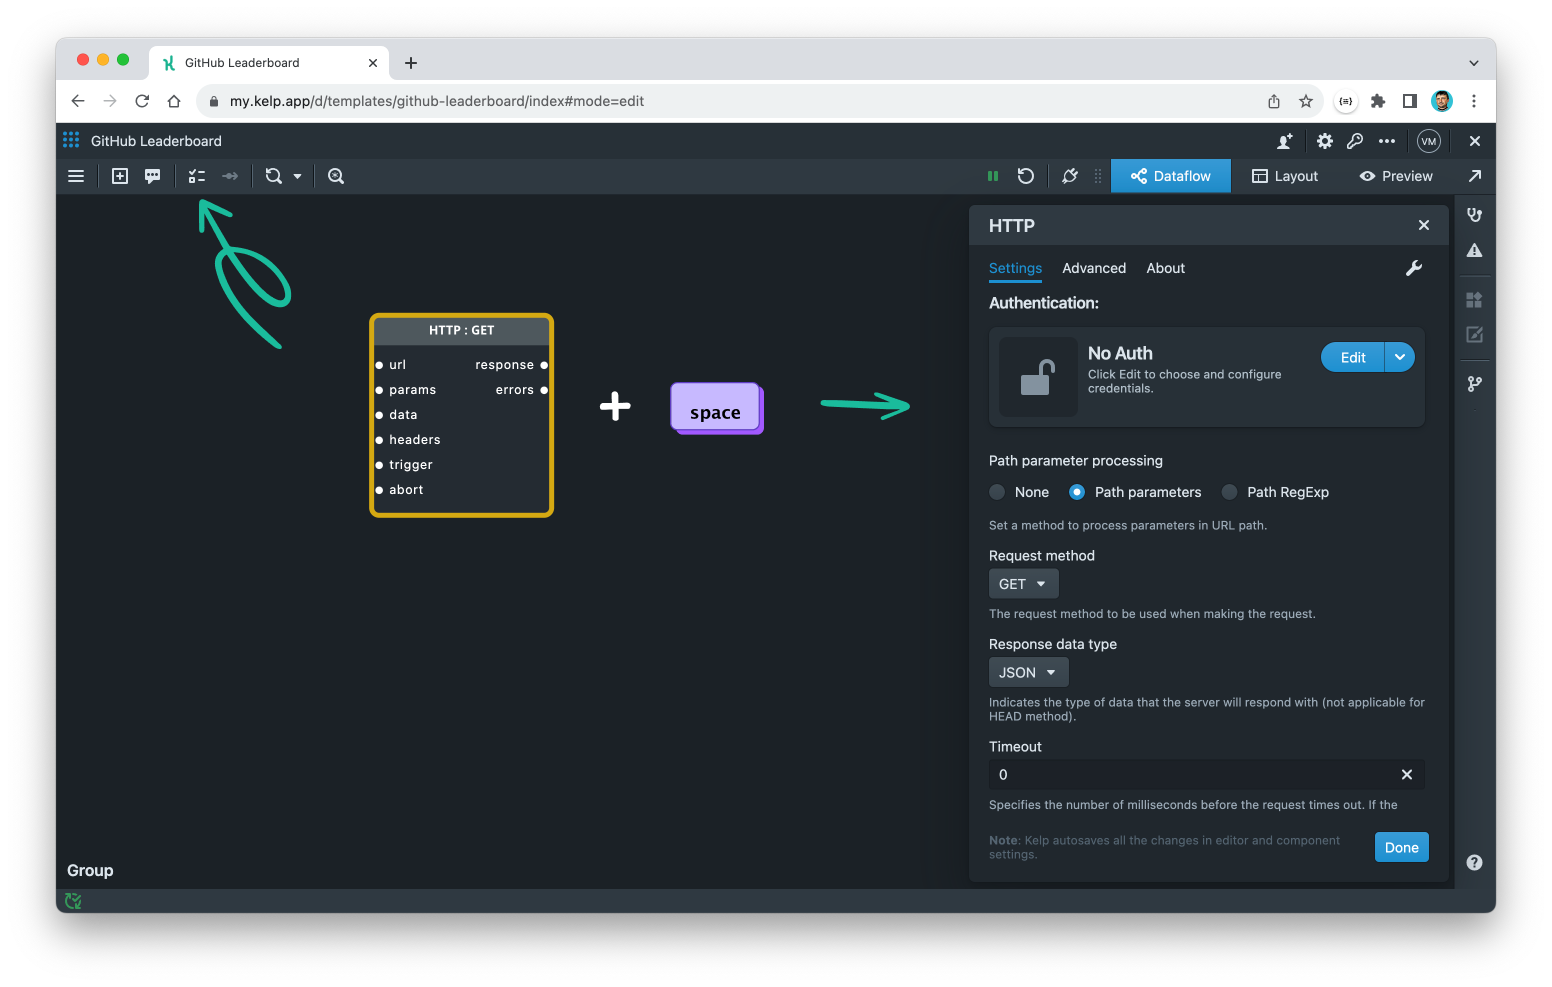
To configure the HTTP component, open its Settings dialog by selecting it and clicking on the Component Settings button on the top toolbar or by pressing the space key. Set the authentication to No Auth and the request method to GET. Leave all other settings at their defaults.
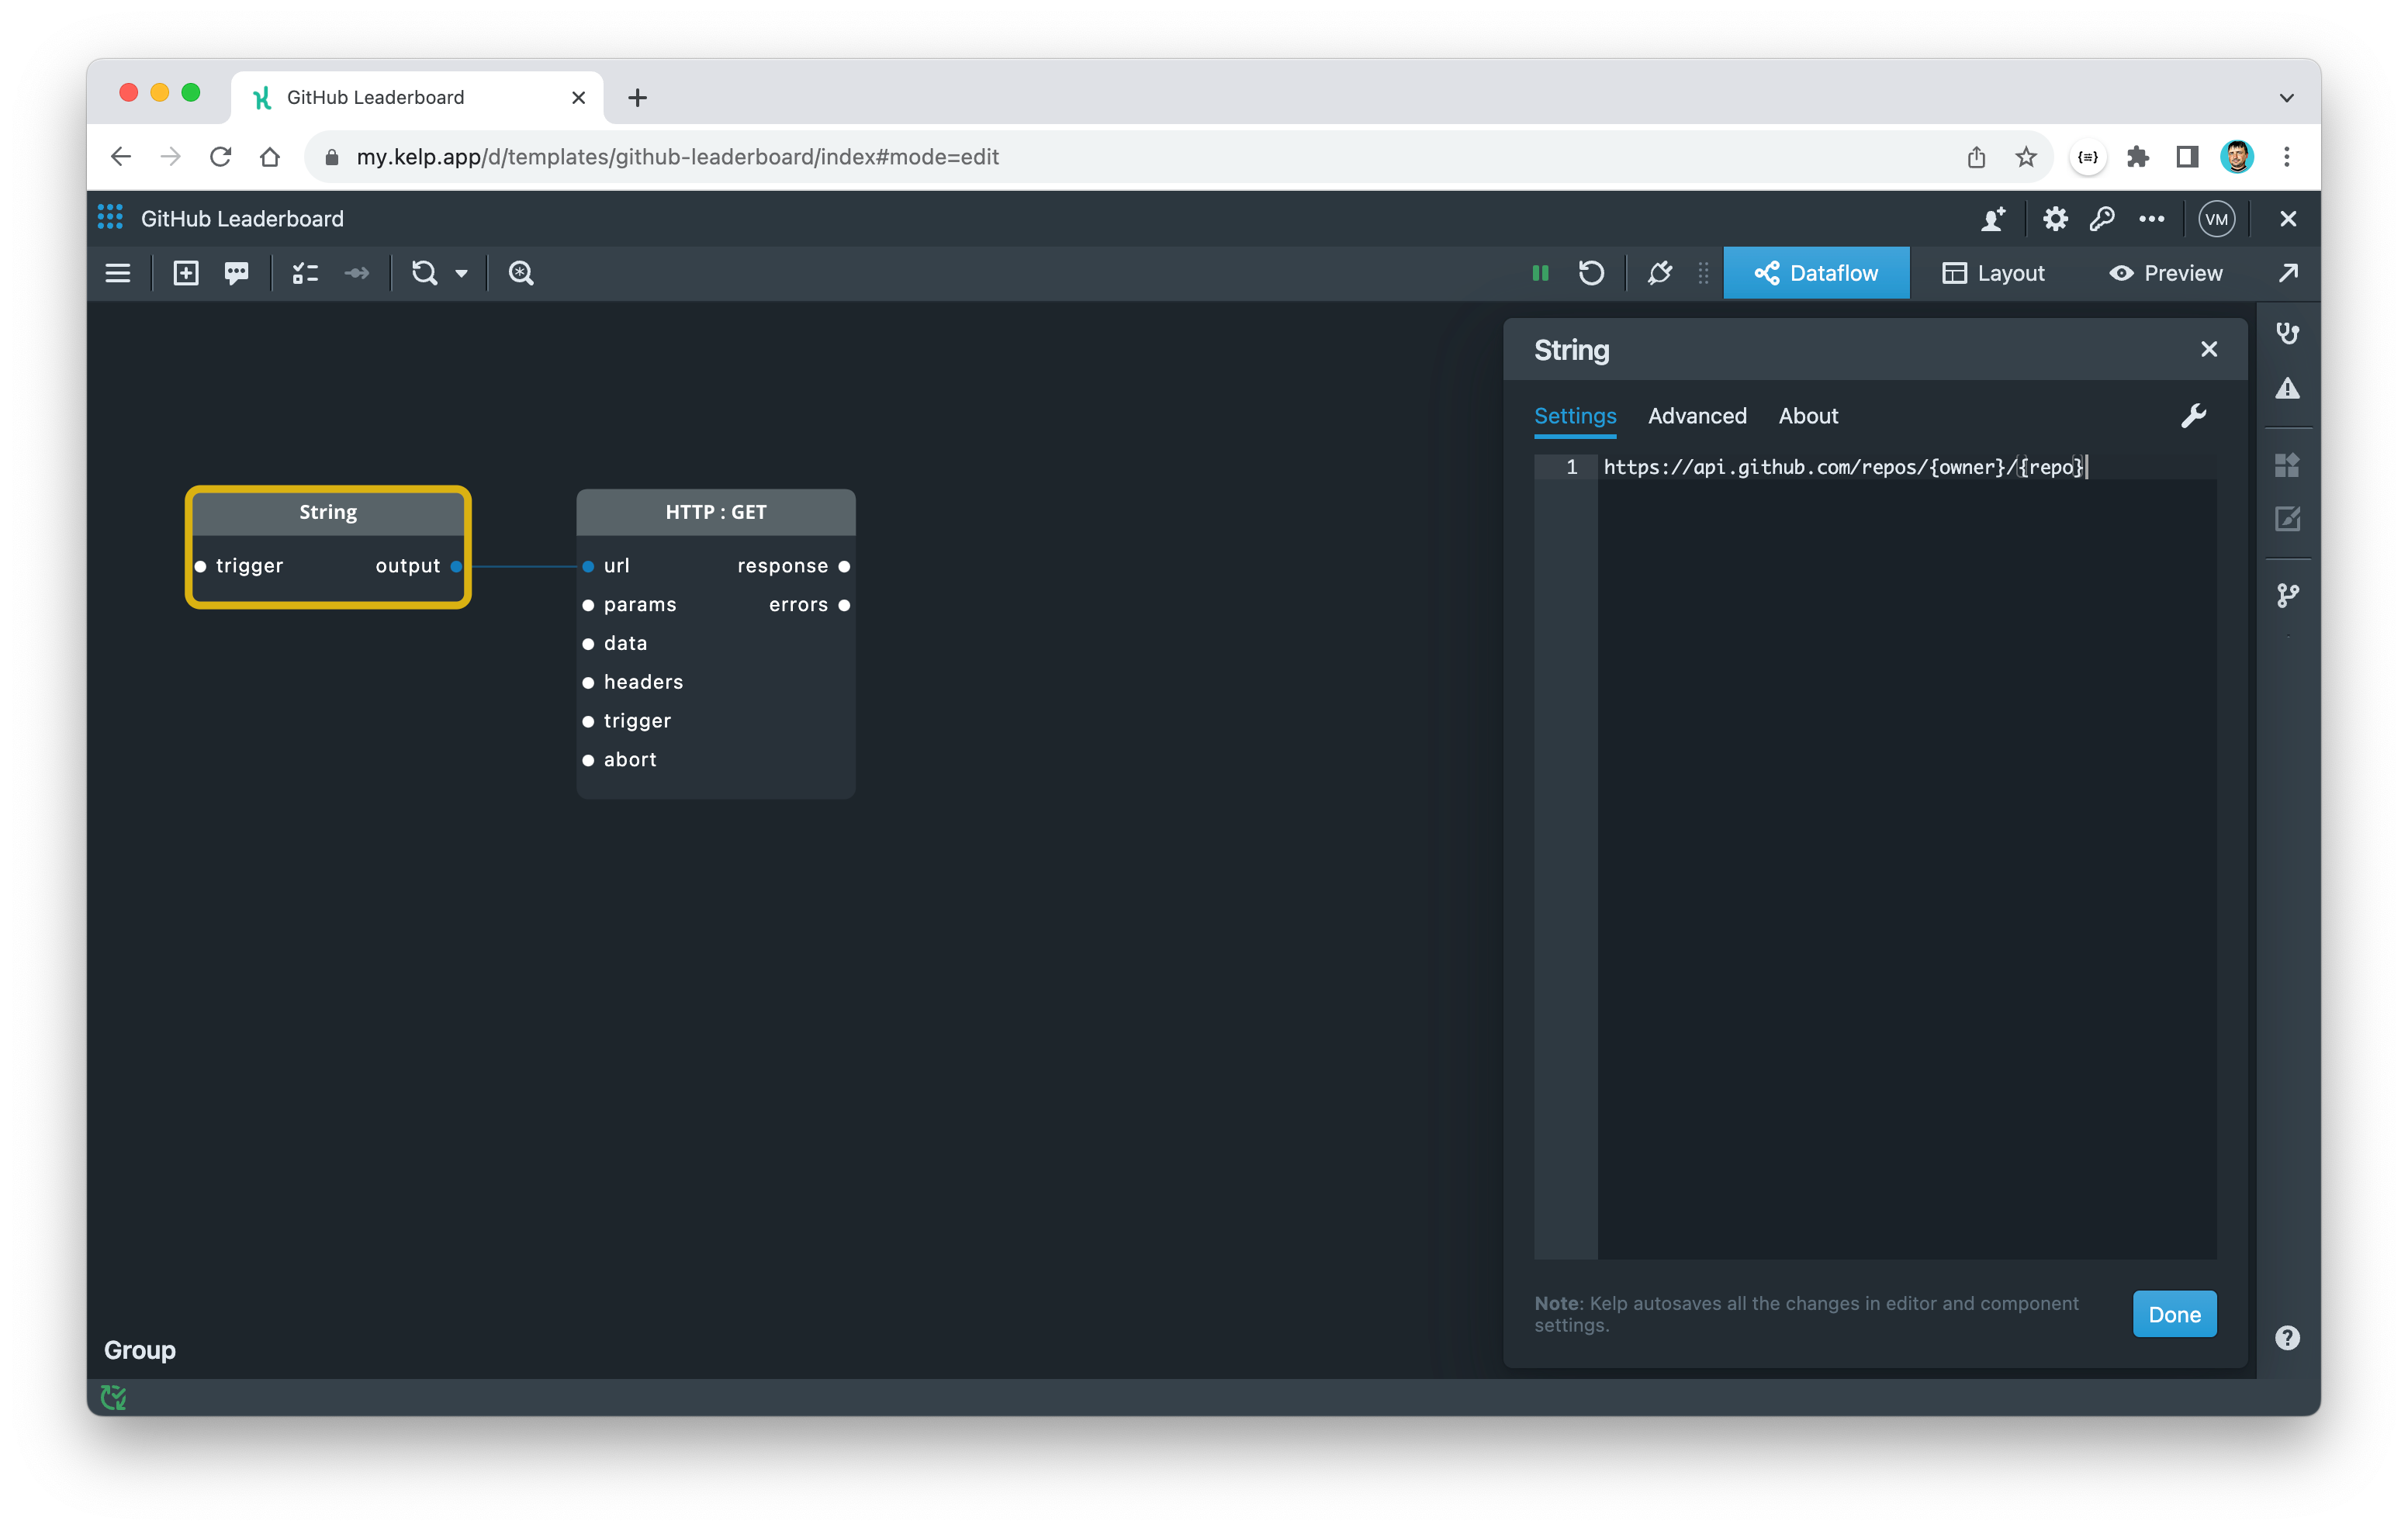
Next, you need to configure the URL to which the HTTP component will make a request. To do this, use a String constant from the library and specify the following value.
https://api.github.com/repos/{owner}/{repo}
Then, connect the output port of the constant to the url port of the HTTP component using a wire. This is how data is transmitted in Kelp. It travels from one port to another (from left to right) through wires as JSON-wrapped objects called events.
Use curly brackets to define placeholders for URL parameters such as {owner} and {repo} tokens. Pass parameter values as JSON objects to the params port to update values at runtime.
Go ahead and add the JSON constant, configure it with the following value, and then connect it to the params port of the HTTP component. Feel free to replace the values with your favorite repository.
{
	"owner": "facebook",
	"repo": "react"
}
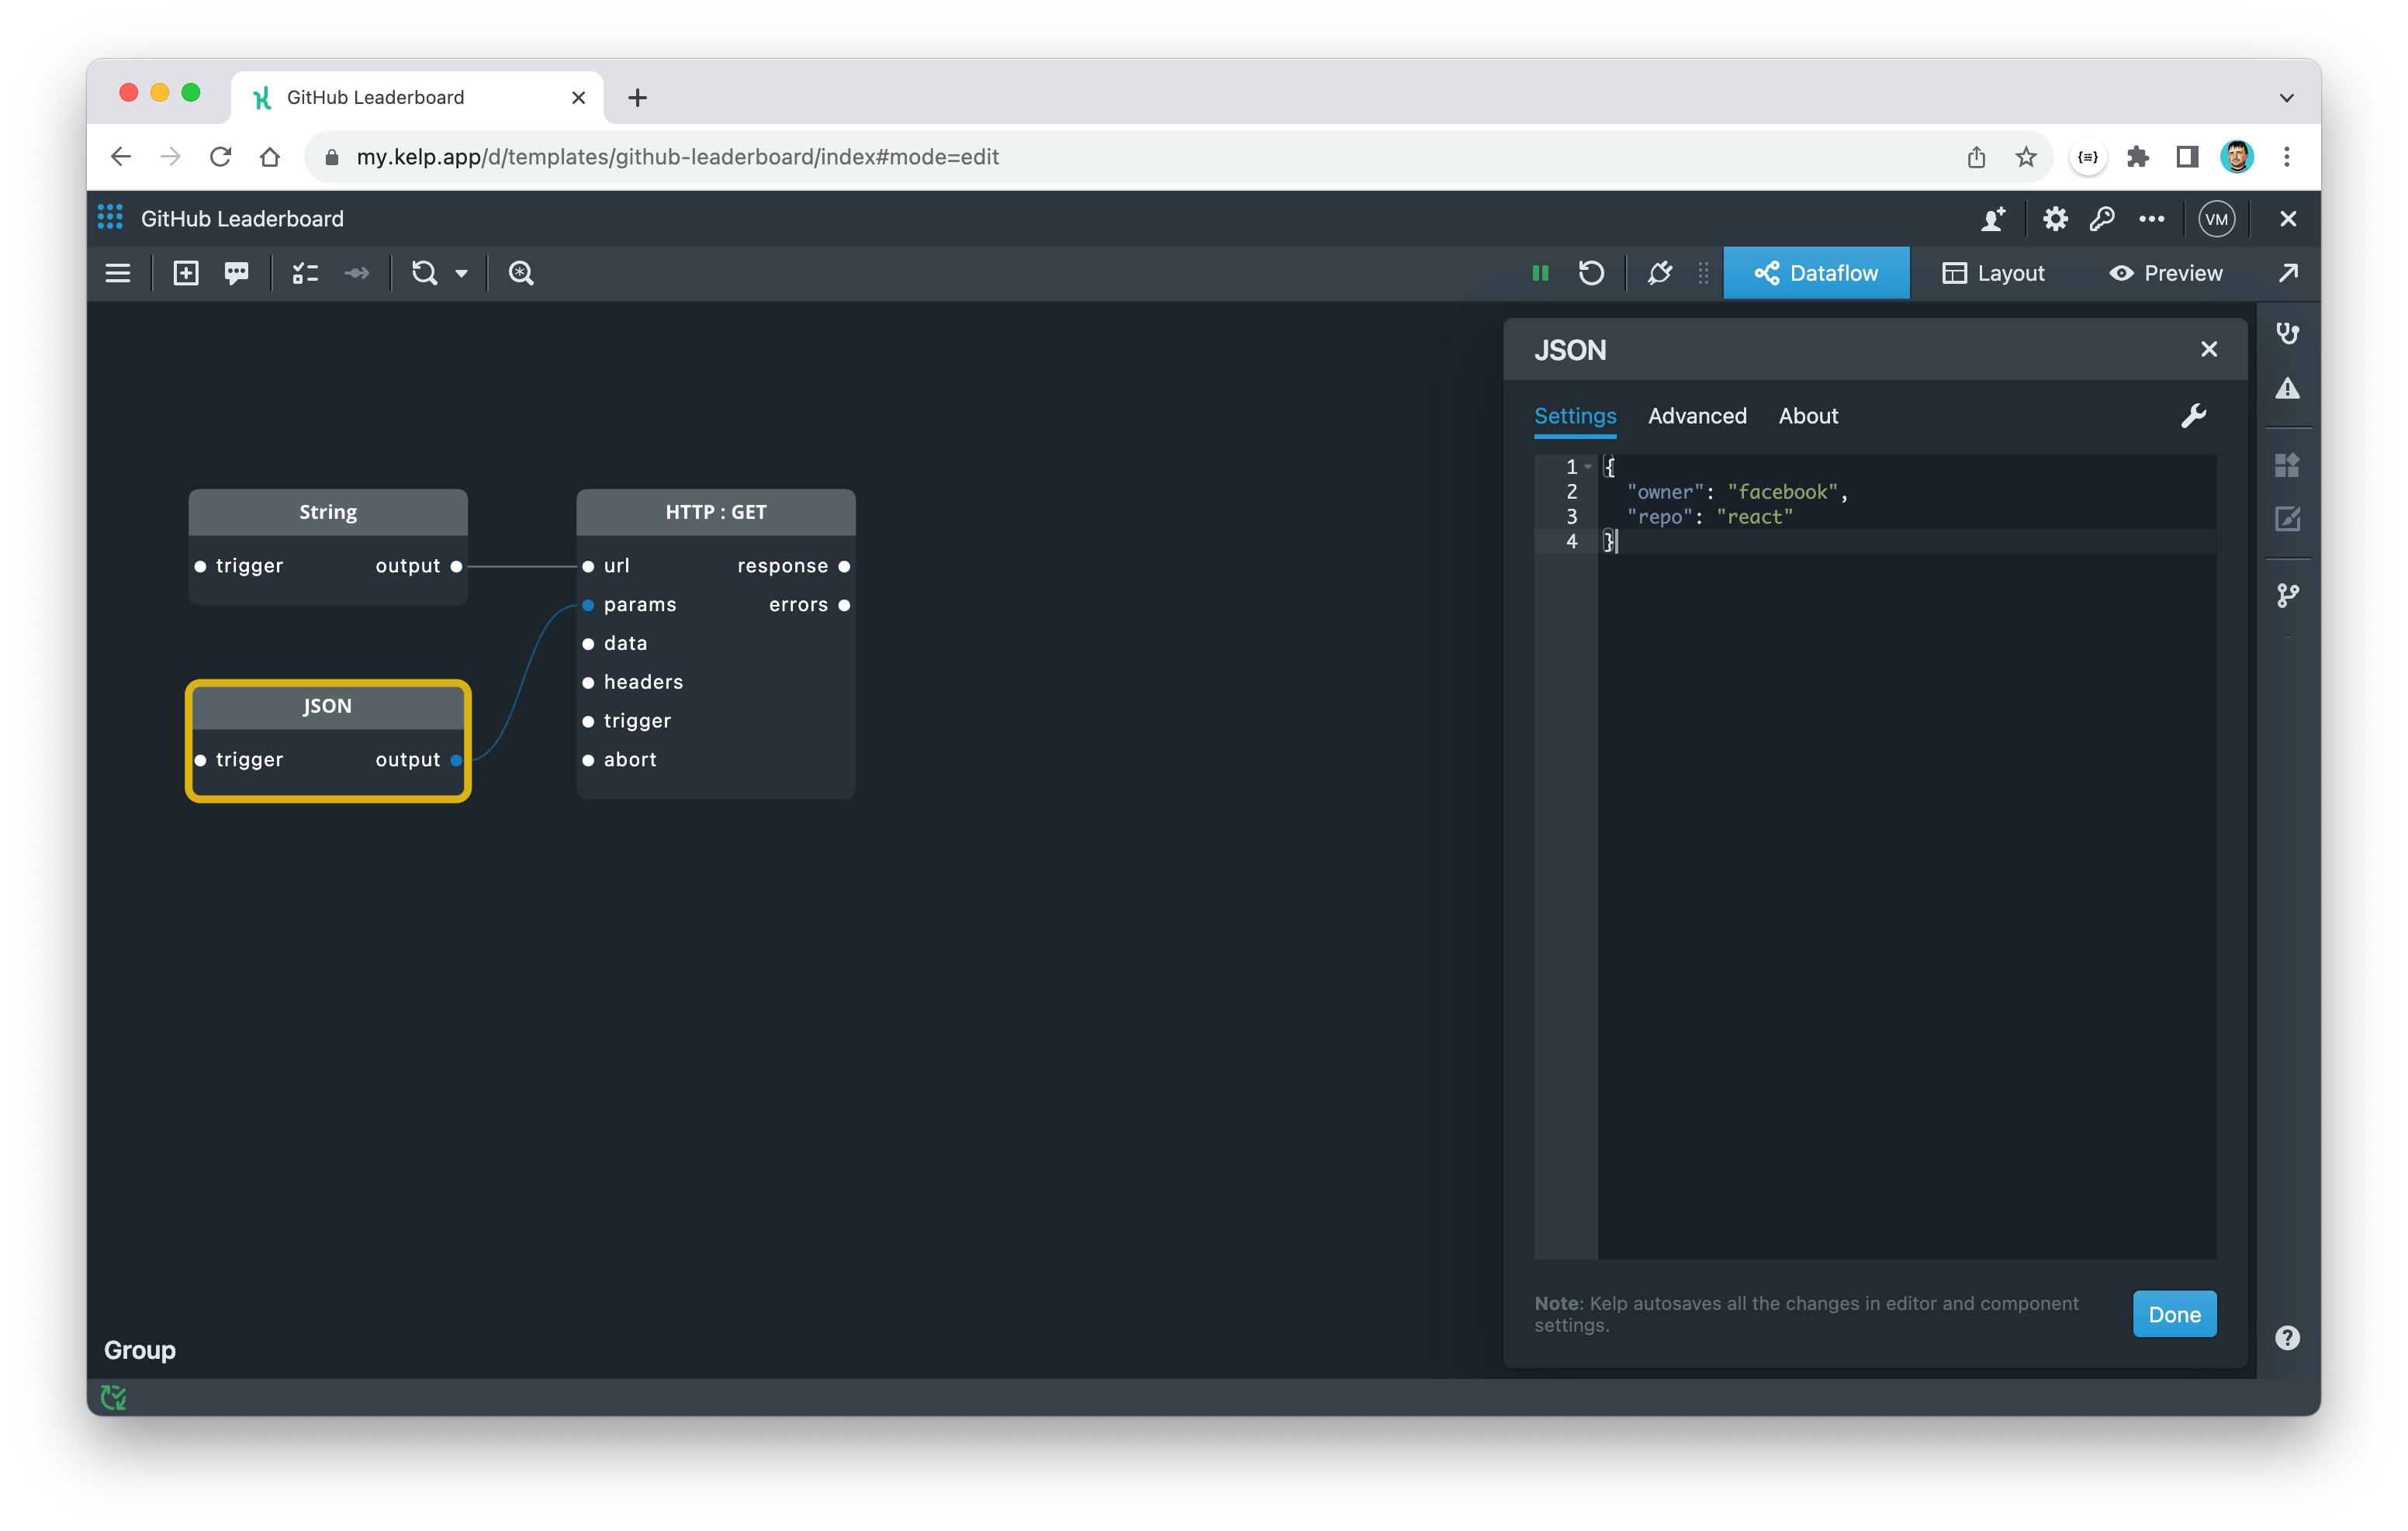
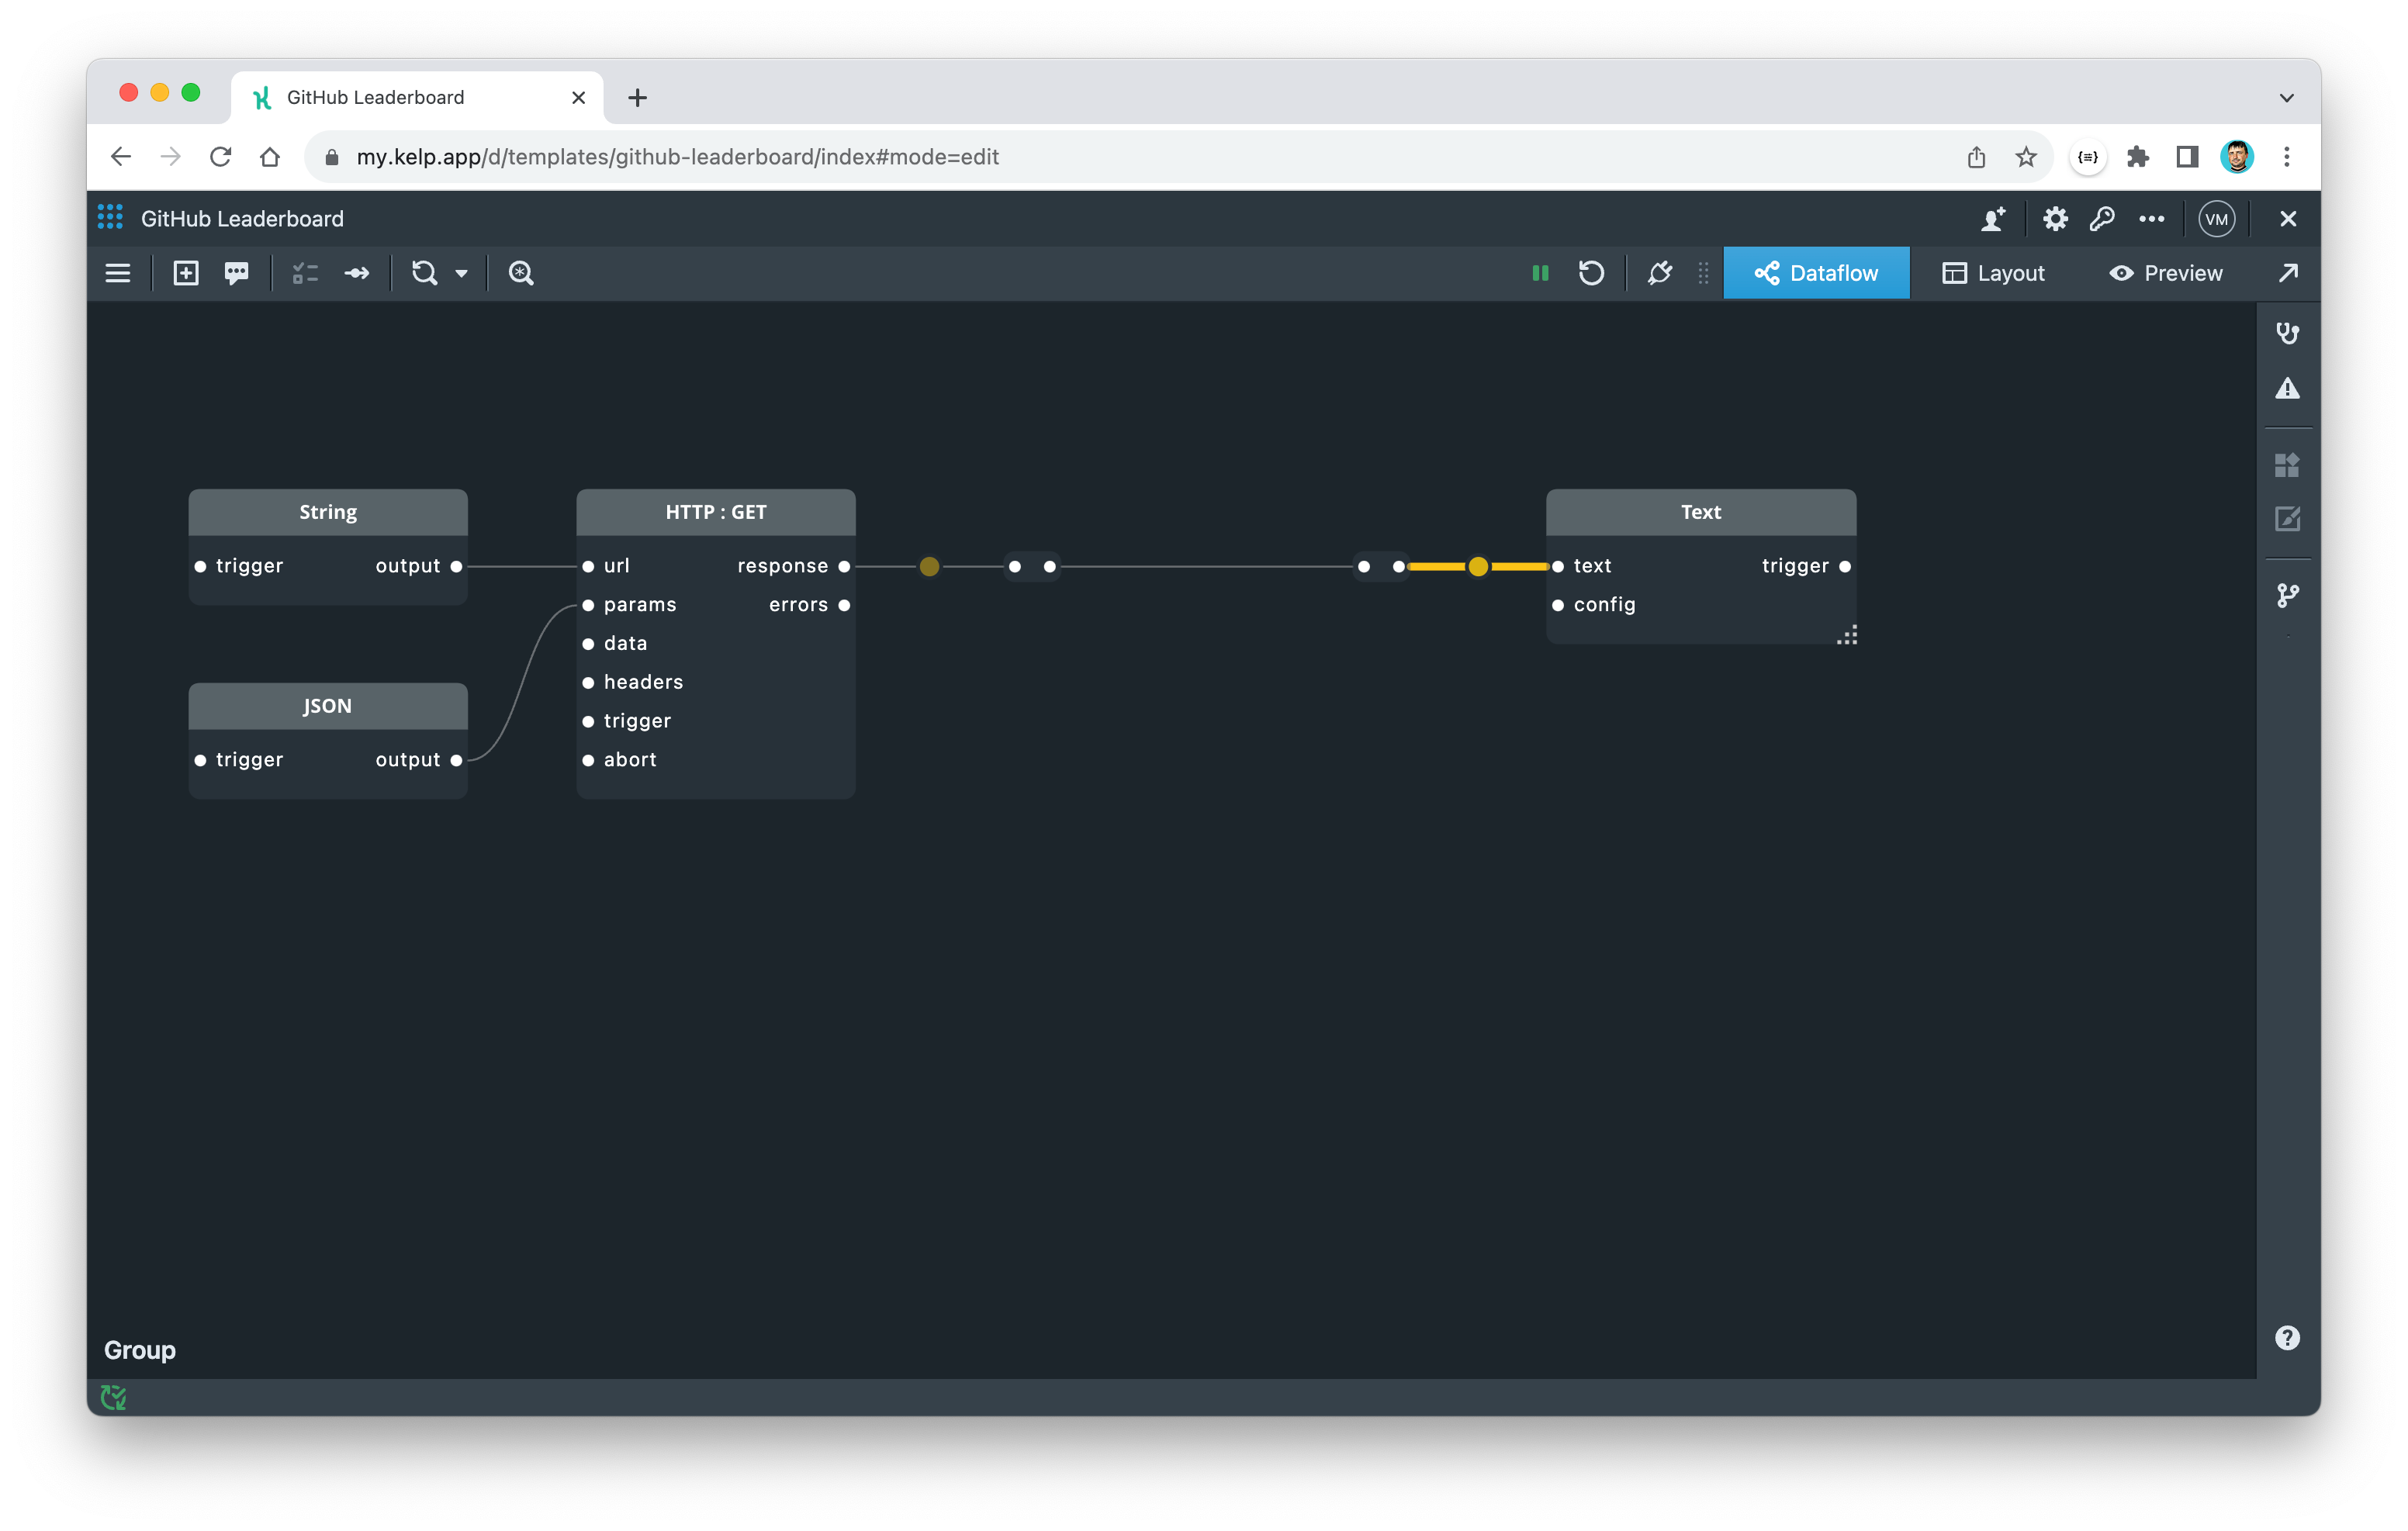
That's all you need to configure a simple REST API call. Now you can test it by connecting a component to the response port that will allow you to see the data. In Kelp, these types of components are called widgets. There are many different types of widgets, from a simple Log widget that displays events as is, to more complex data visualizations like Vega-Lite Chart or Table widgets. Let's use a simple Log widget.
- Add a Log widget.
- Connect the
responseport of the HTTP component to thedataport of the Log widget. - Expand the Log widget by dragging its bottom-right corner.
- Restart the app to trigger the HTTP component to make a request to the configured API endpoint.
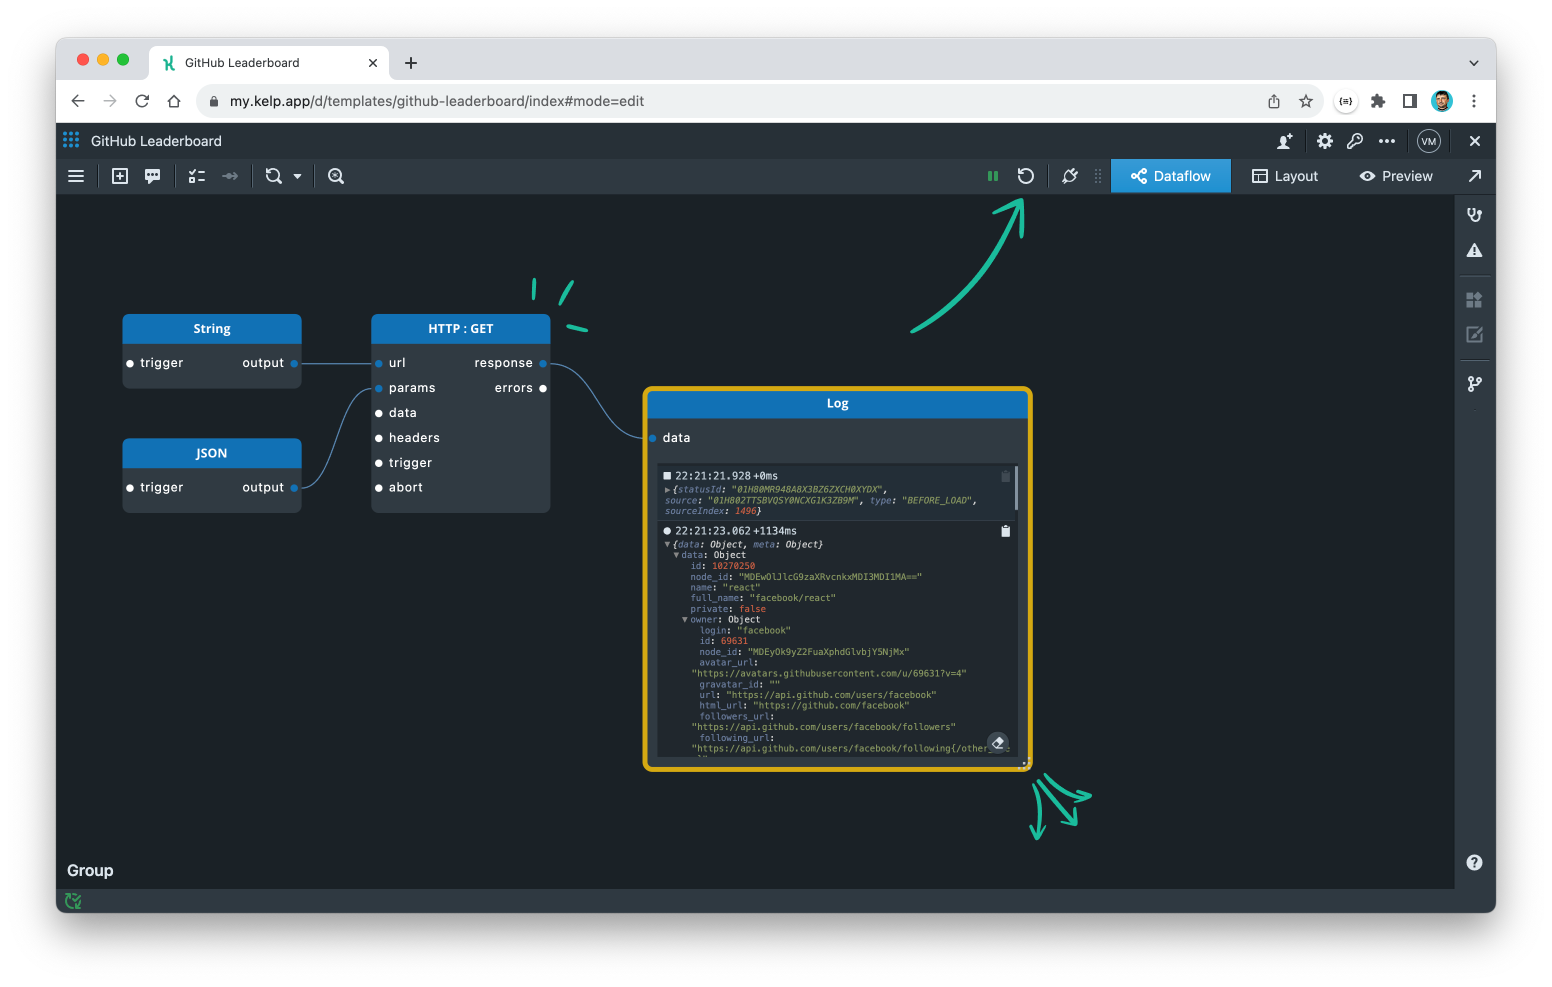
Expand the response JSON within the Log widget to verify that you have received the correct data.
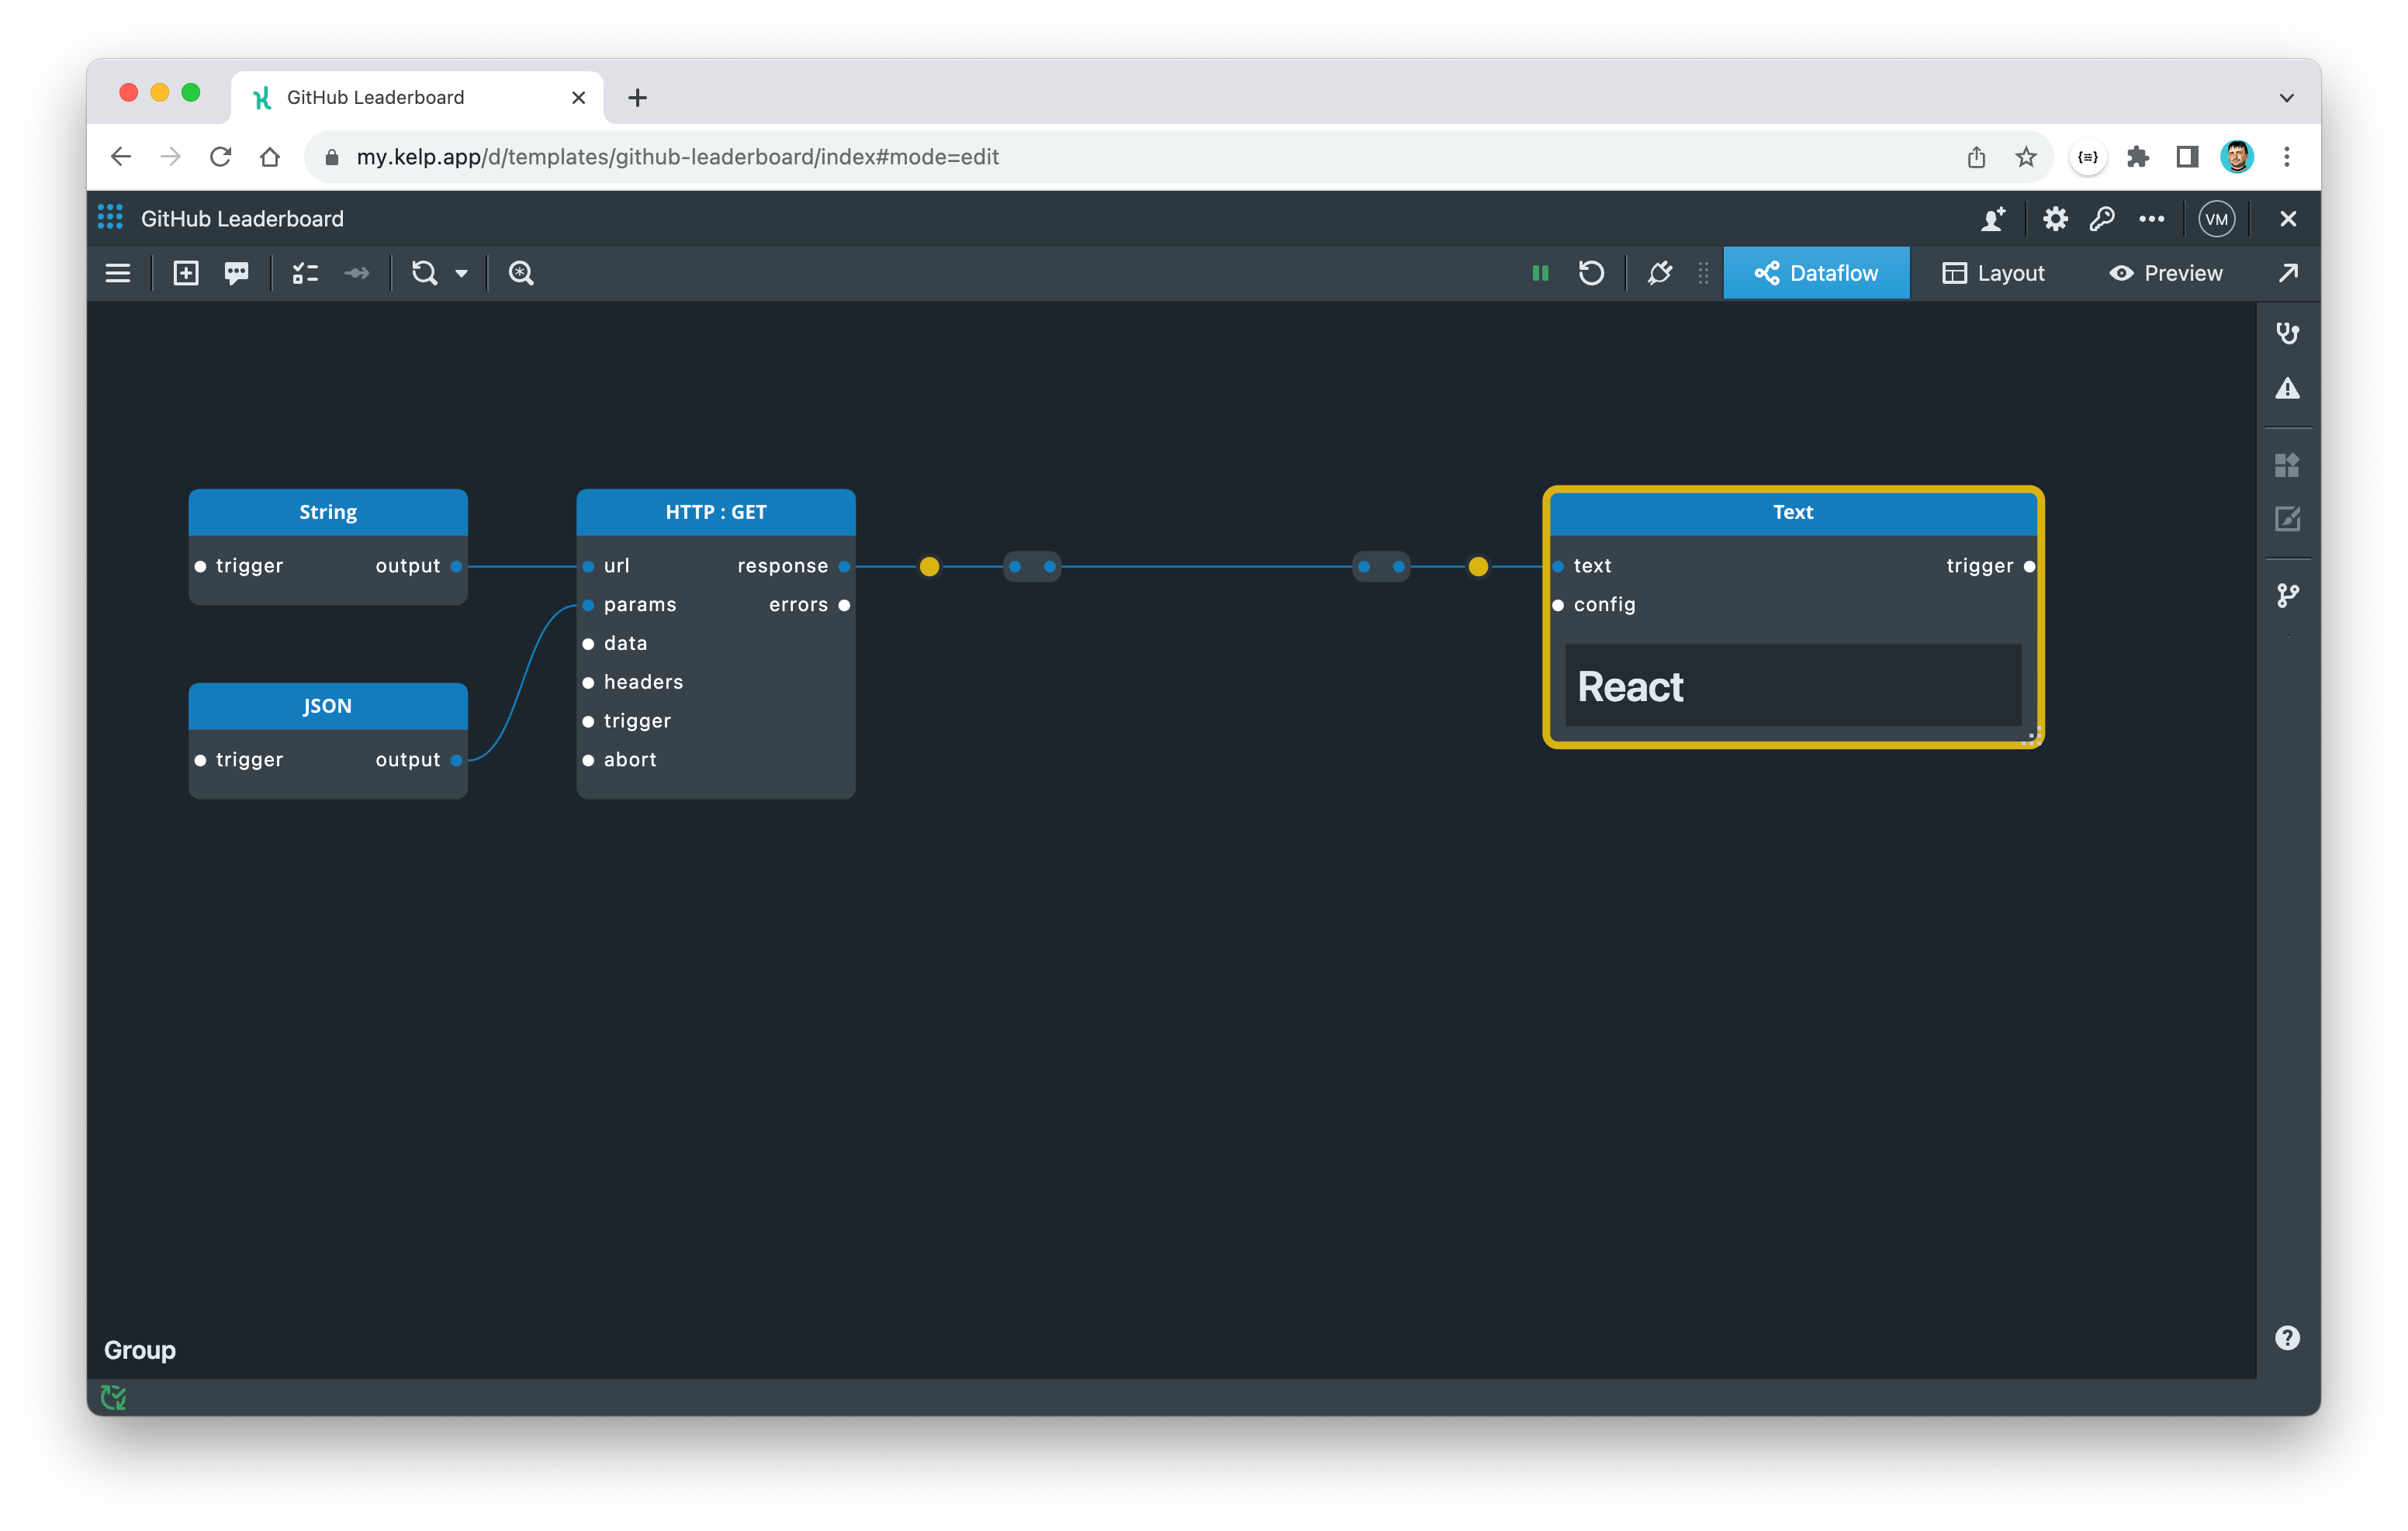
If a part of the application graph is not connected to any downstream widget, it will become inactive and all the nodes in it will be grayed out. Once a widget is connected and activated, all upstream components will also become activated (blue headers). Only active components can perform their functions and propagate events. To activate a widget, either expand it on the canvas or place it on the layout.
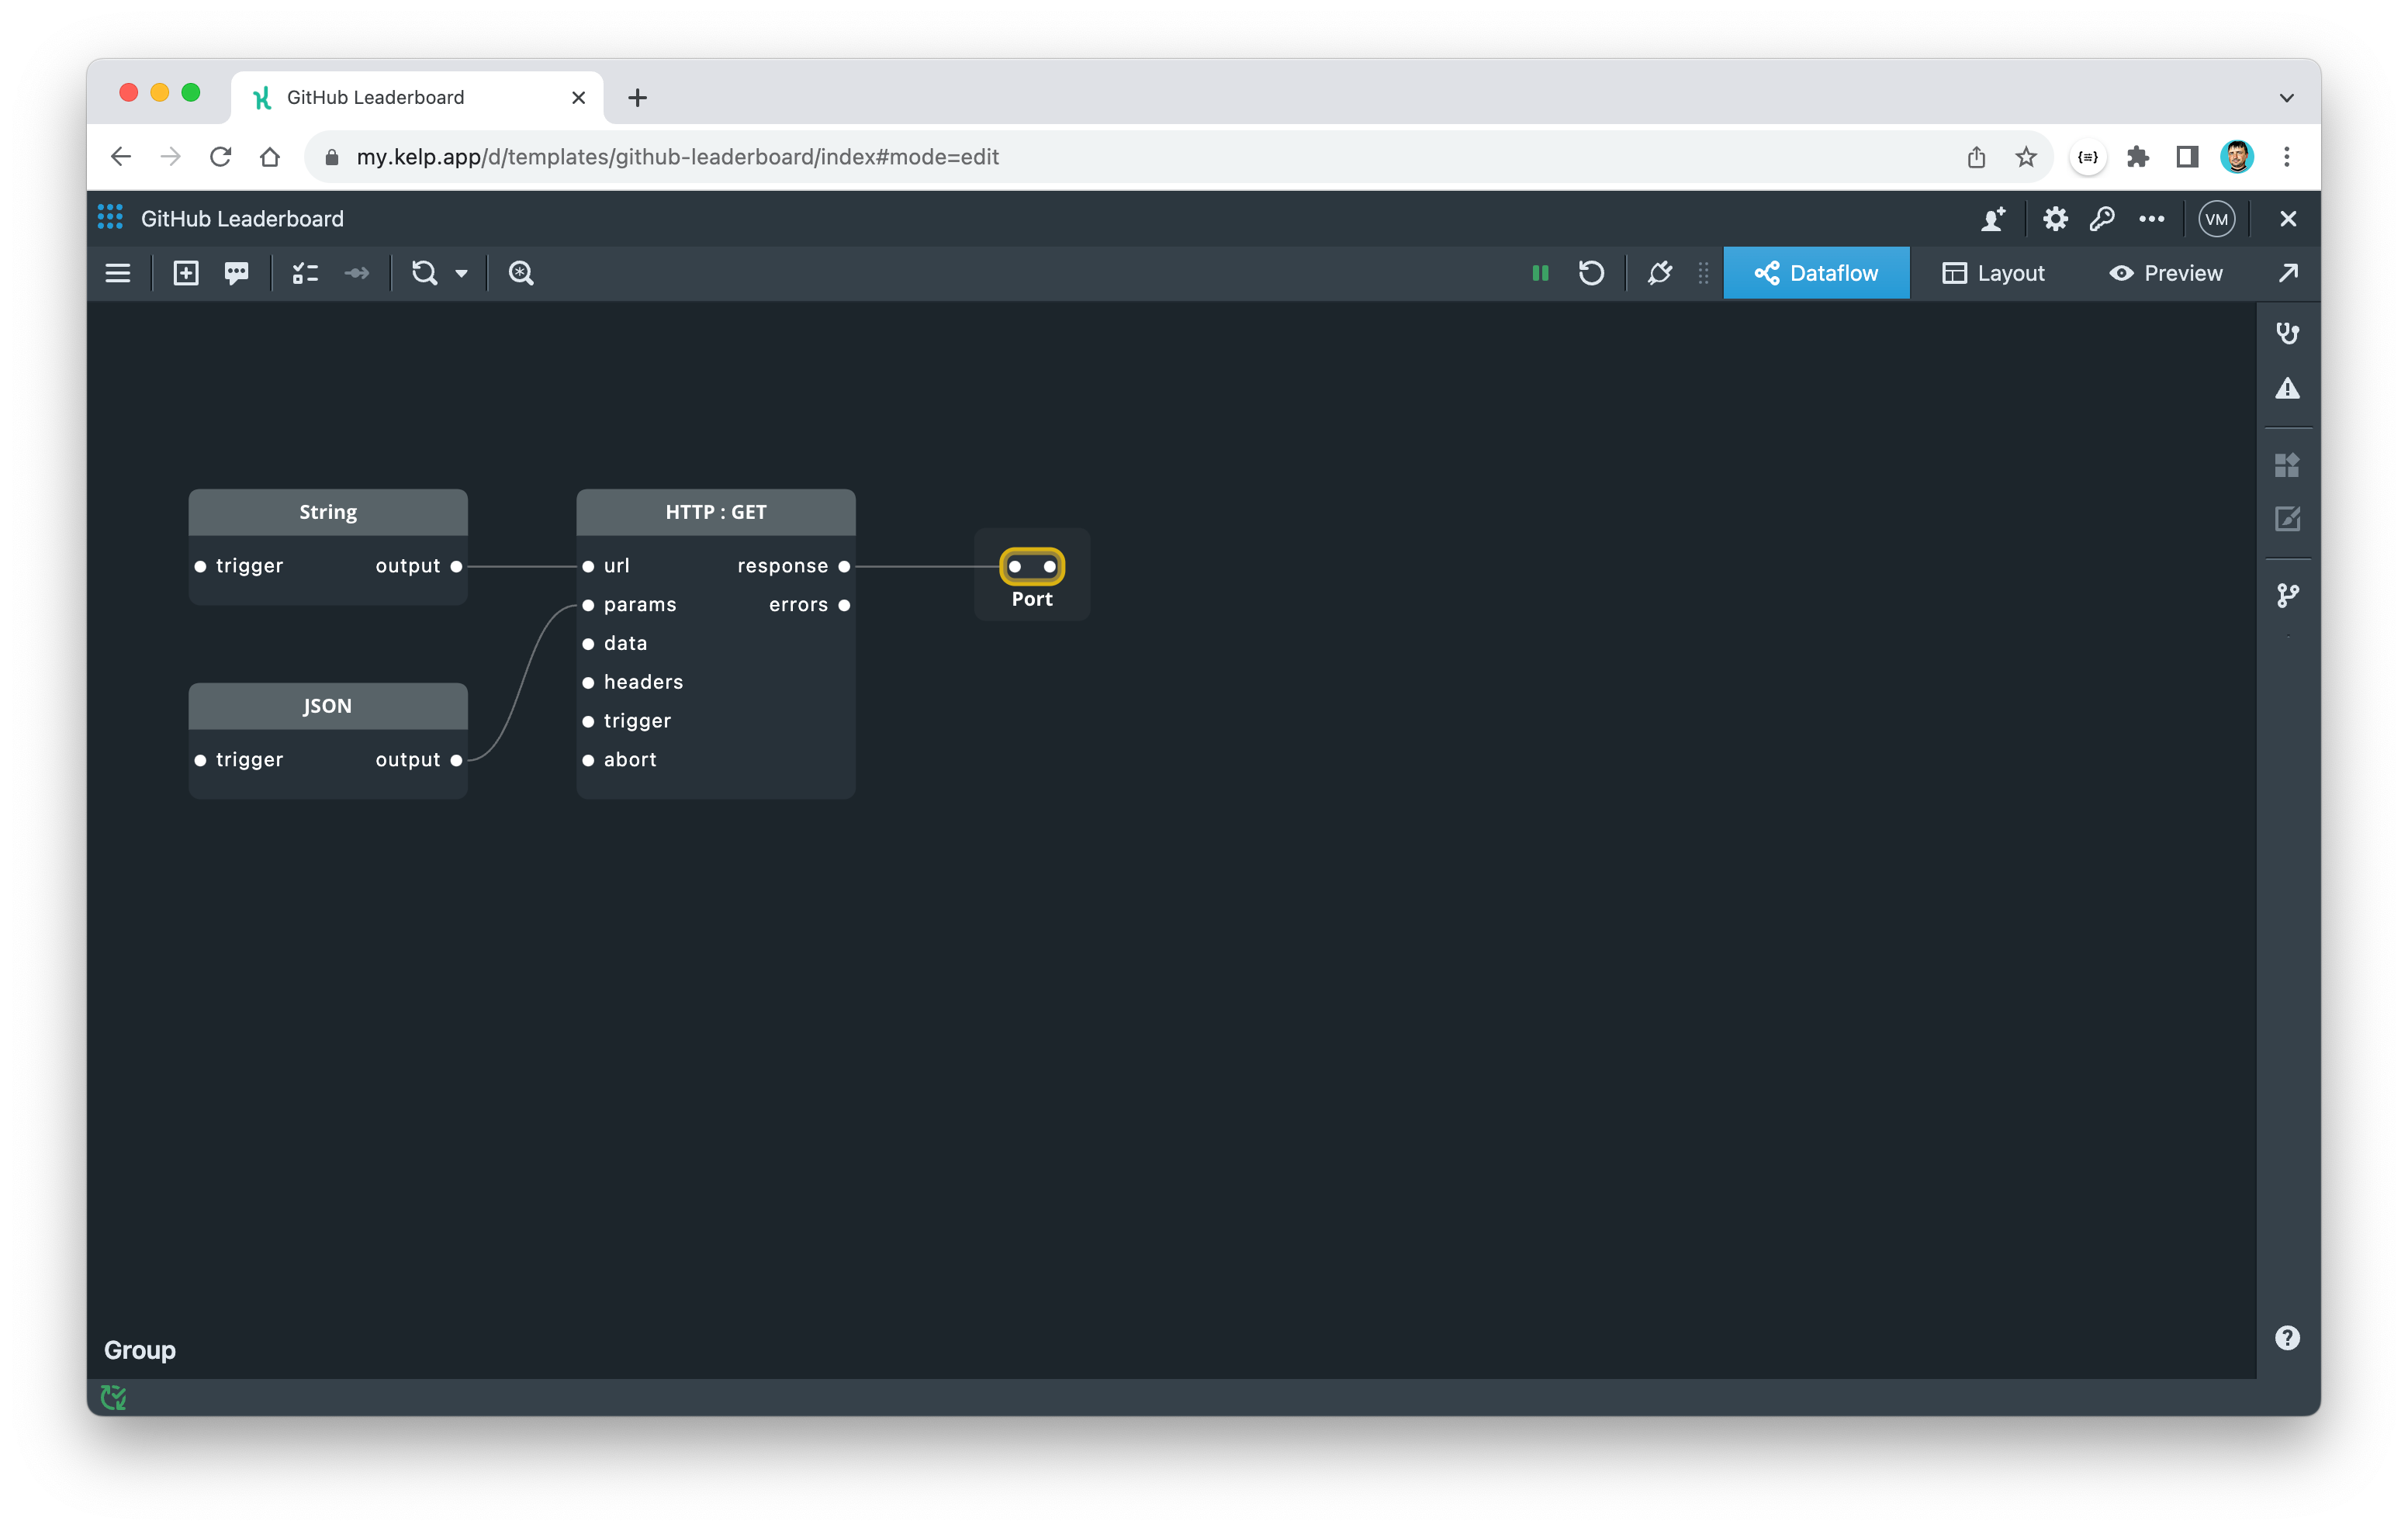
Moving on, if you drag a port from any component and drop it anywhere on the canvas, Kelp will automatically place a simple Port component that is wired to that port. The Port component does not modify the passing events and is useful for organizing the wires in your app neatly. You can connect any number of wires to either its input or output side.
The Port component is also useful for creating data transformation steps in Kelp. You can assign a data transformation expression to any wire, which will then be applied to all events passing through that wire.
Data transformations are JSON query expressions that modify the structure and format of data as it moves between two components. They act as a "glue" between components that have different input and output formats. Transforming data is one of the most important and powerful features of Kelp as it enables the composability of Kelp apps.
To apply a transformation to the wire between the HTTP component and the Port component:
- Click on the wire to select it
- To open the transformation dialog, you can either click on the "Transformation on wire" button from the menu or press the space key.
- In the transformation dialog, select KelpQL query as the expression language (above the middle panel)
- Enter the following trivial transformation in the middle panel:
data
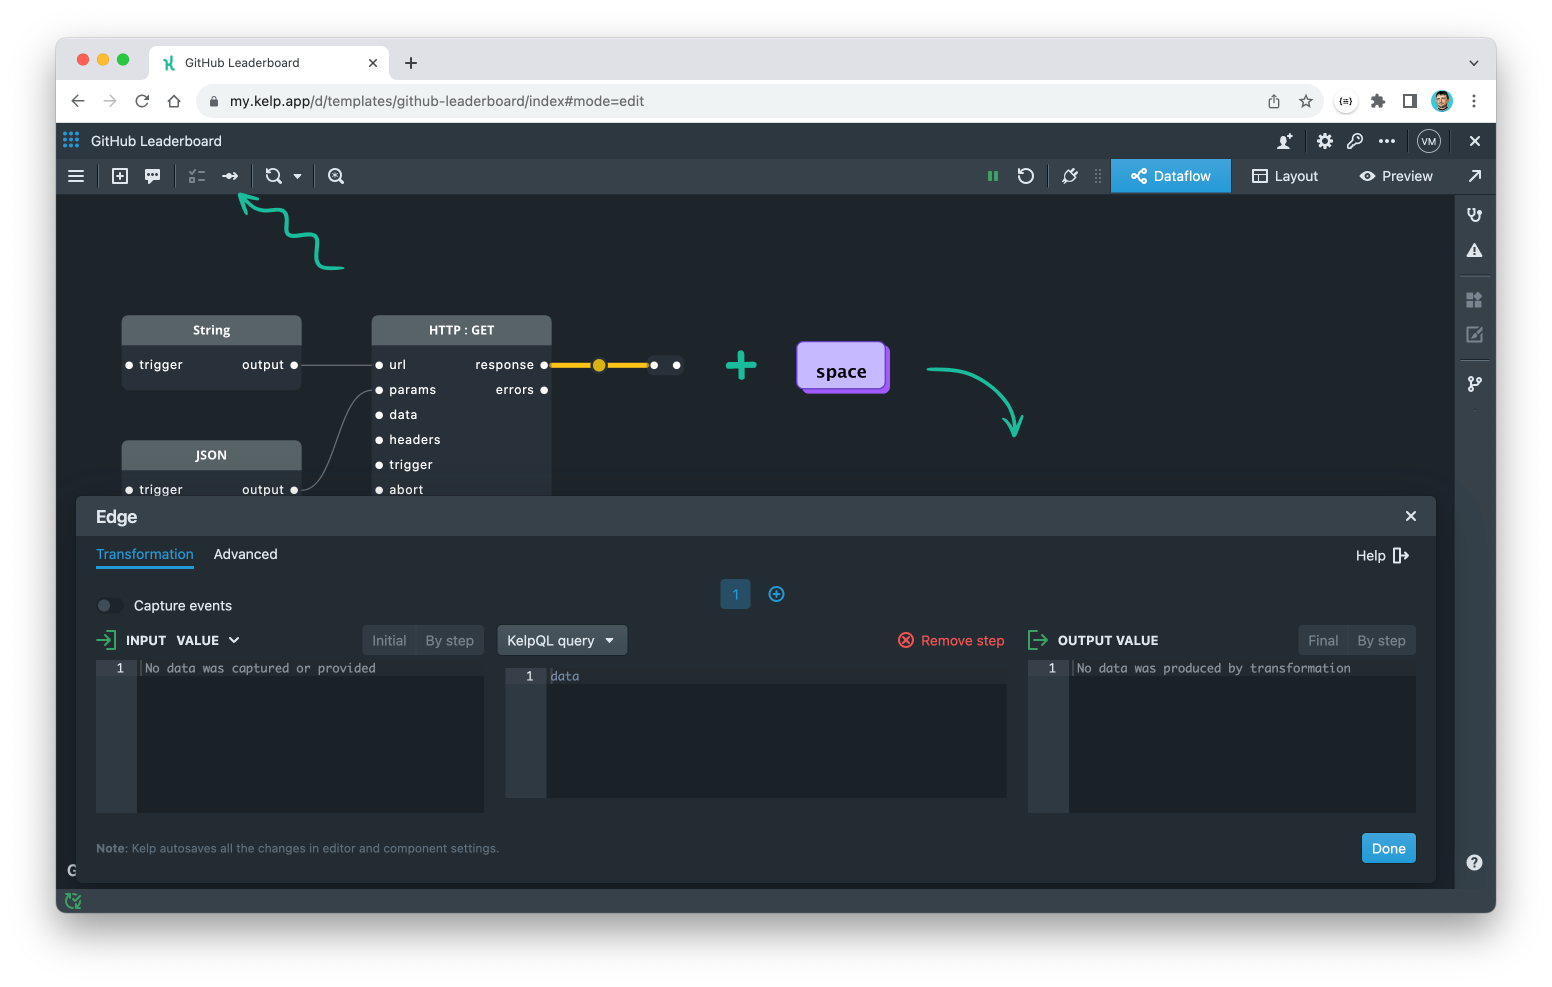
The HTTP component "wraps" the API response into an object with data and meta properties. The transformation above will "unwrap" the response object of the HTTP component and return the value of its data property.
2. Display repo title and summary
After obtaining the data, you can route it to widgets that display it in a user-friendly format.
To display the repository title:
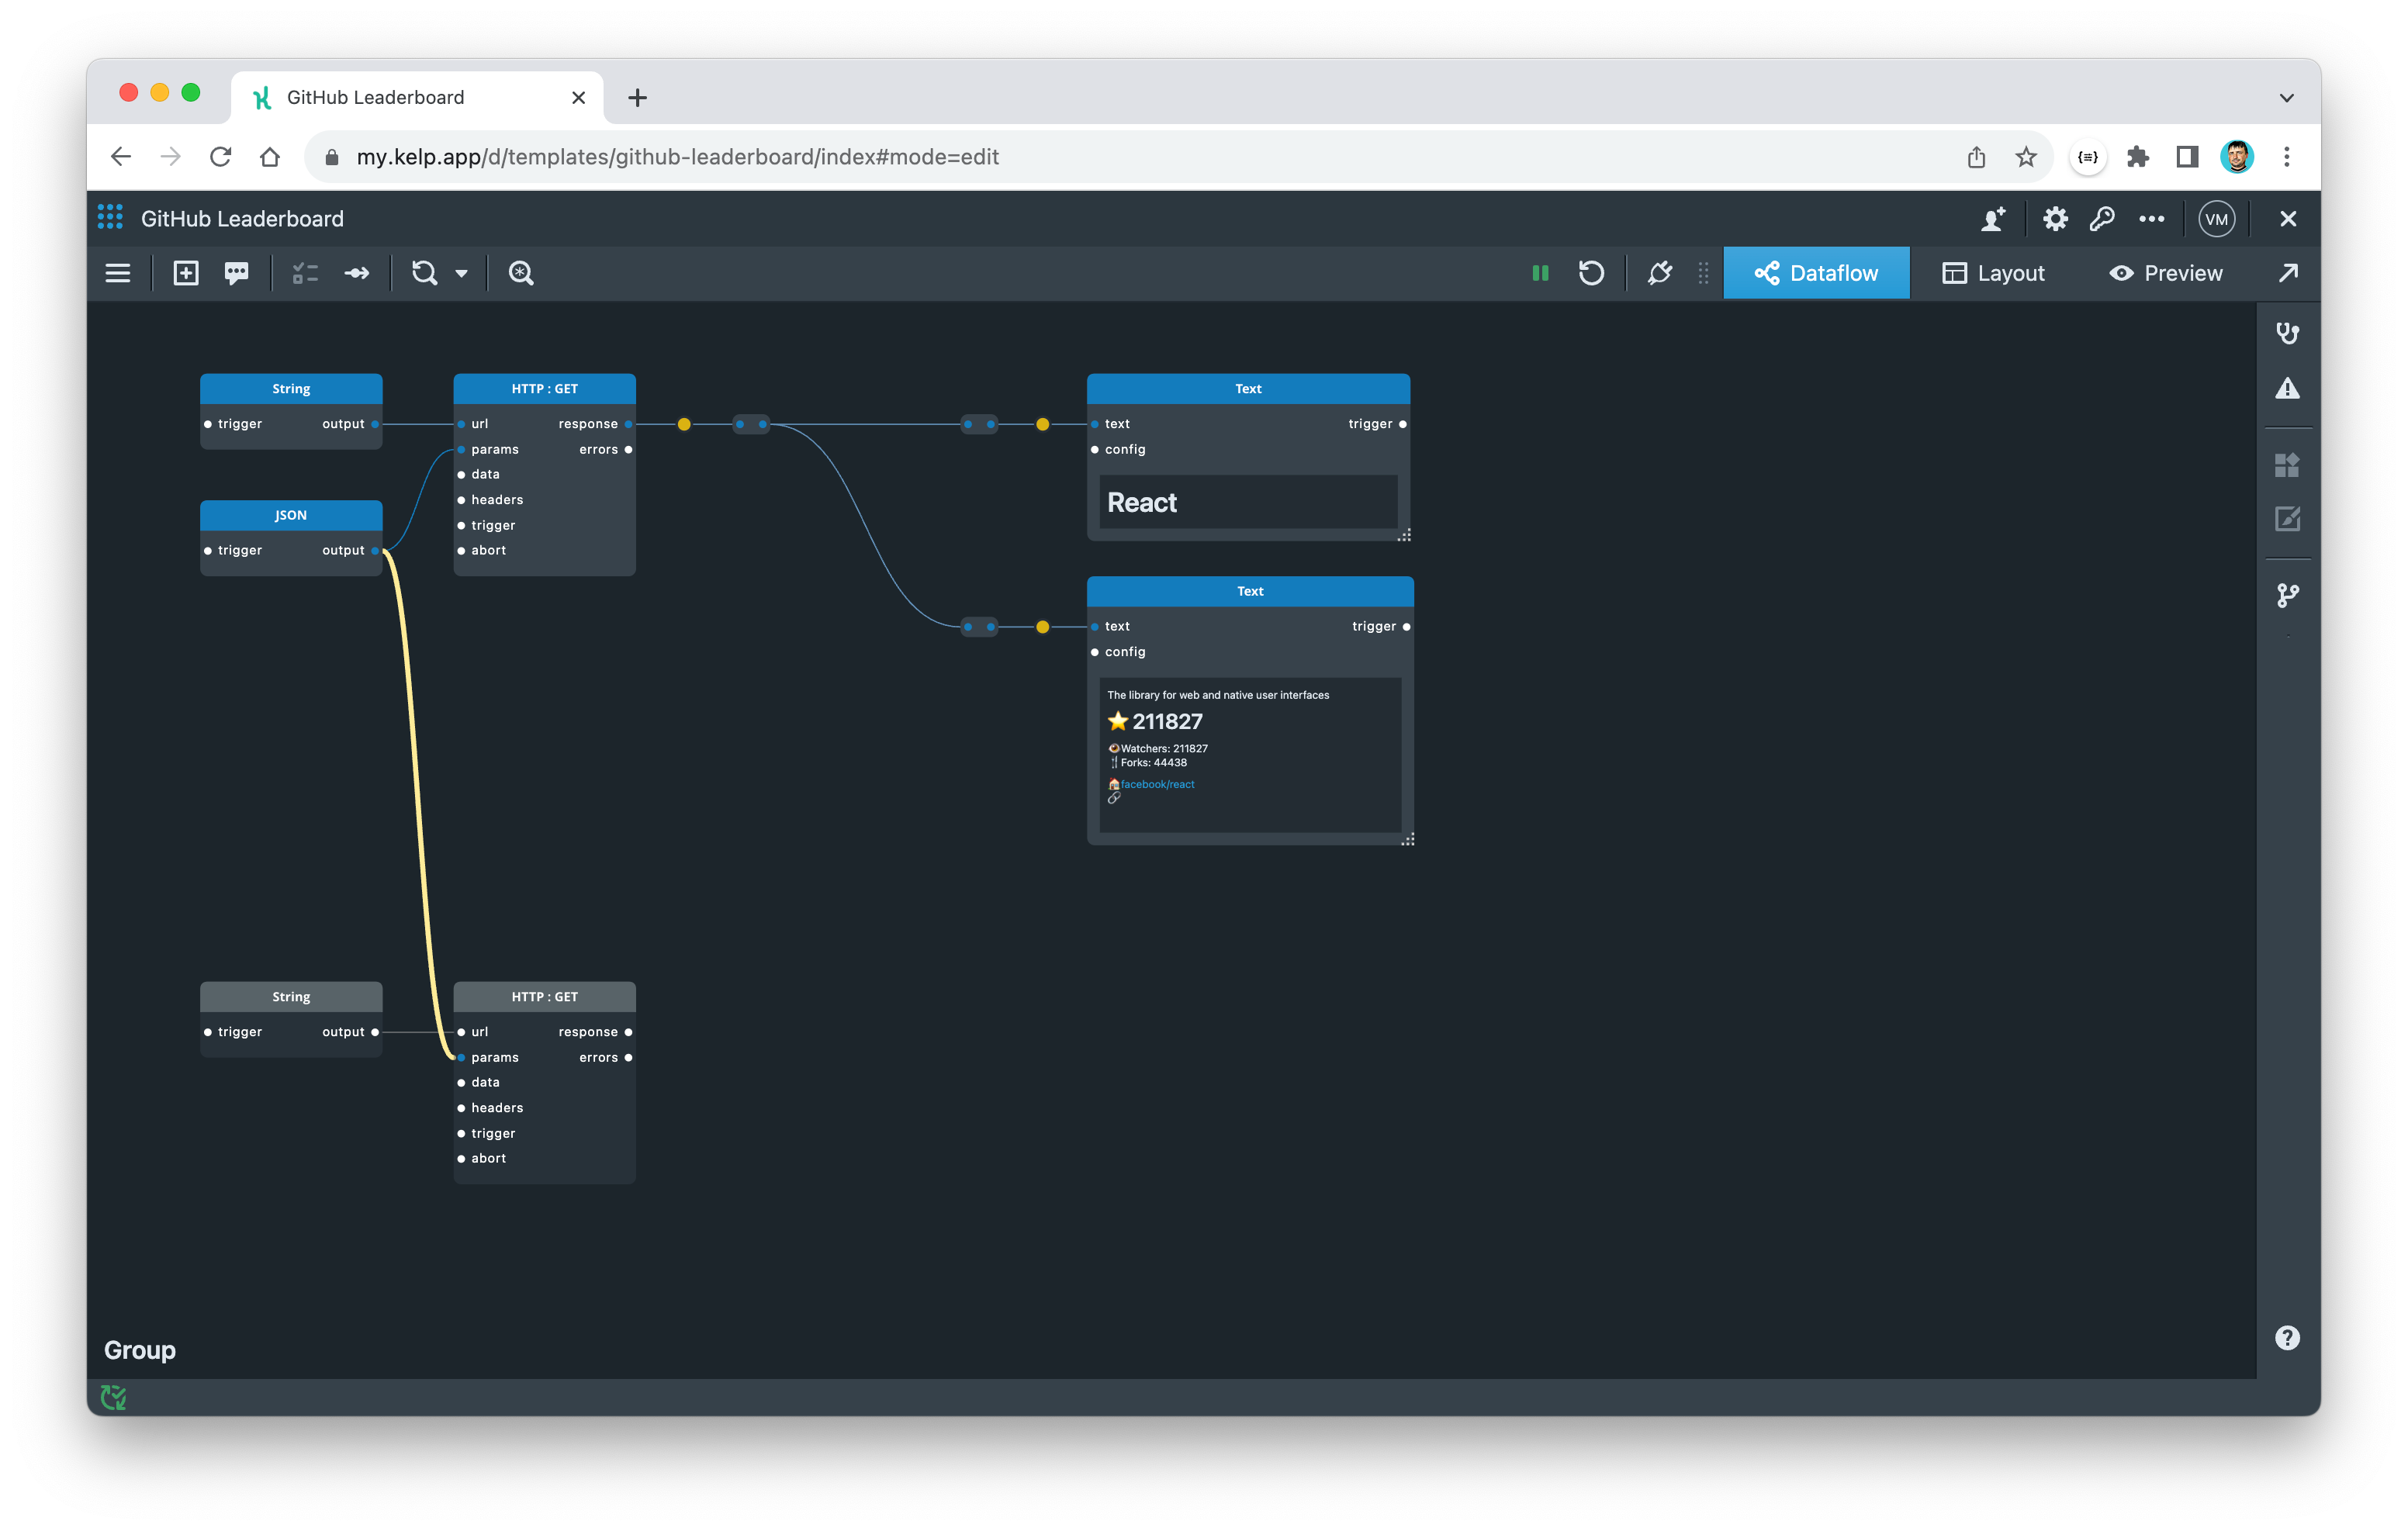
- Add a Text widget and connect its
textport to the transformed output from the HTTP component. - Add the following transformation on the wire to extract and format the title of the repository.
template('# {{name}}', @)
The transformation expression above will take the current context (the whole response object), find the name property in it, and substitute it into the template string. The result will be a string that starts with a ‘#’ followed by the value of the name property. The Text widget supports markdown text, so we added a '#' symbol in the template to display the title as an H1 header.
To view the result:
- Expand the Text widget.
- Restart the app.
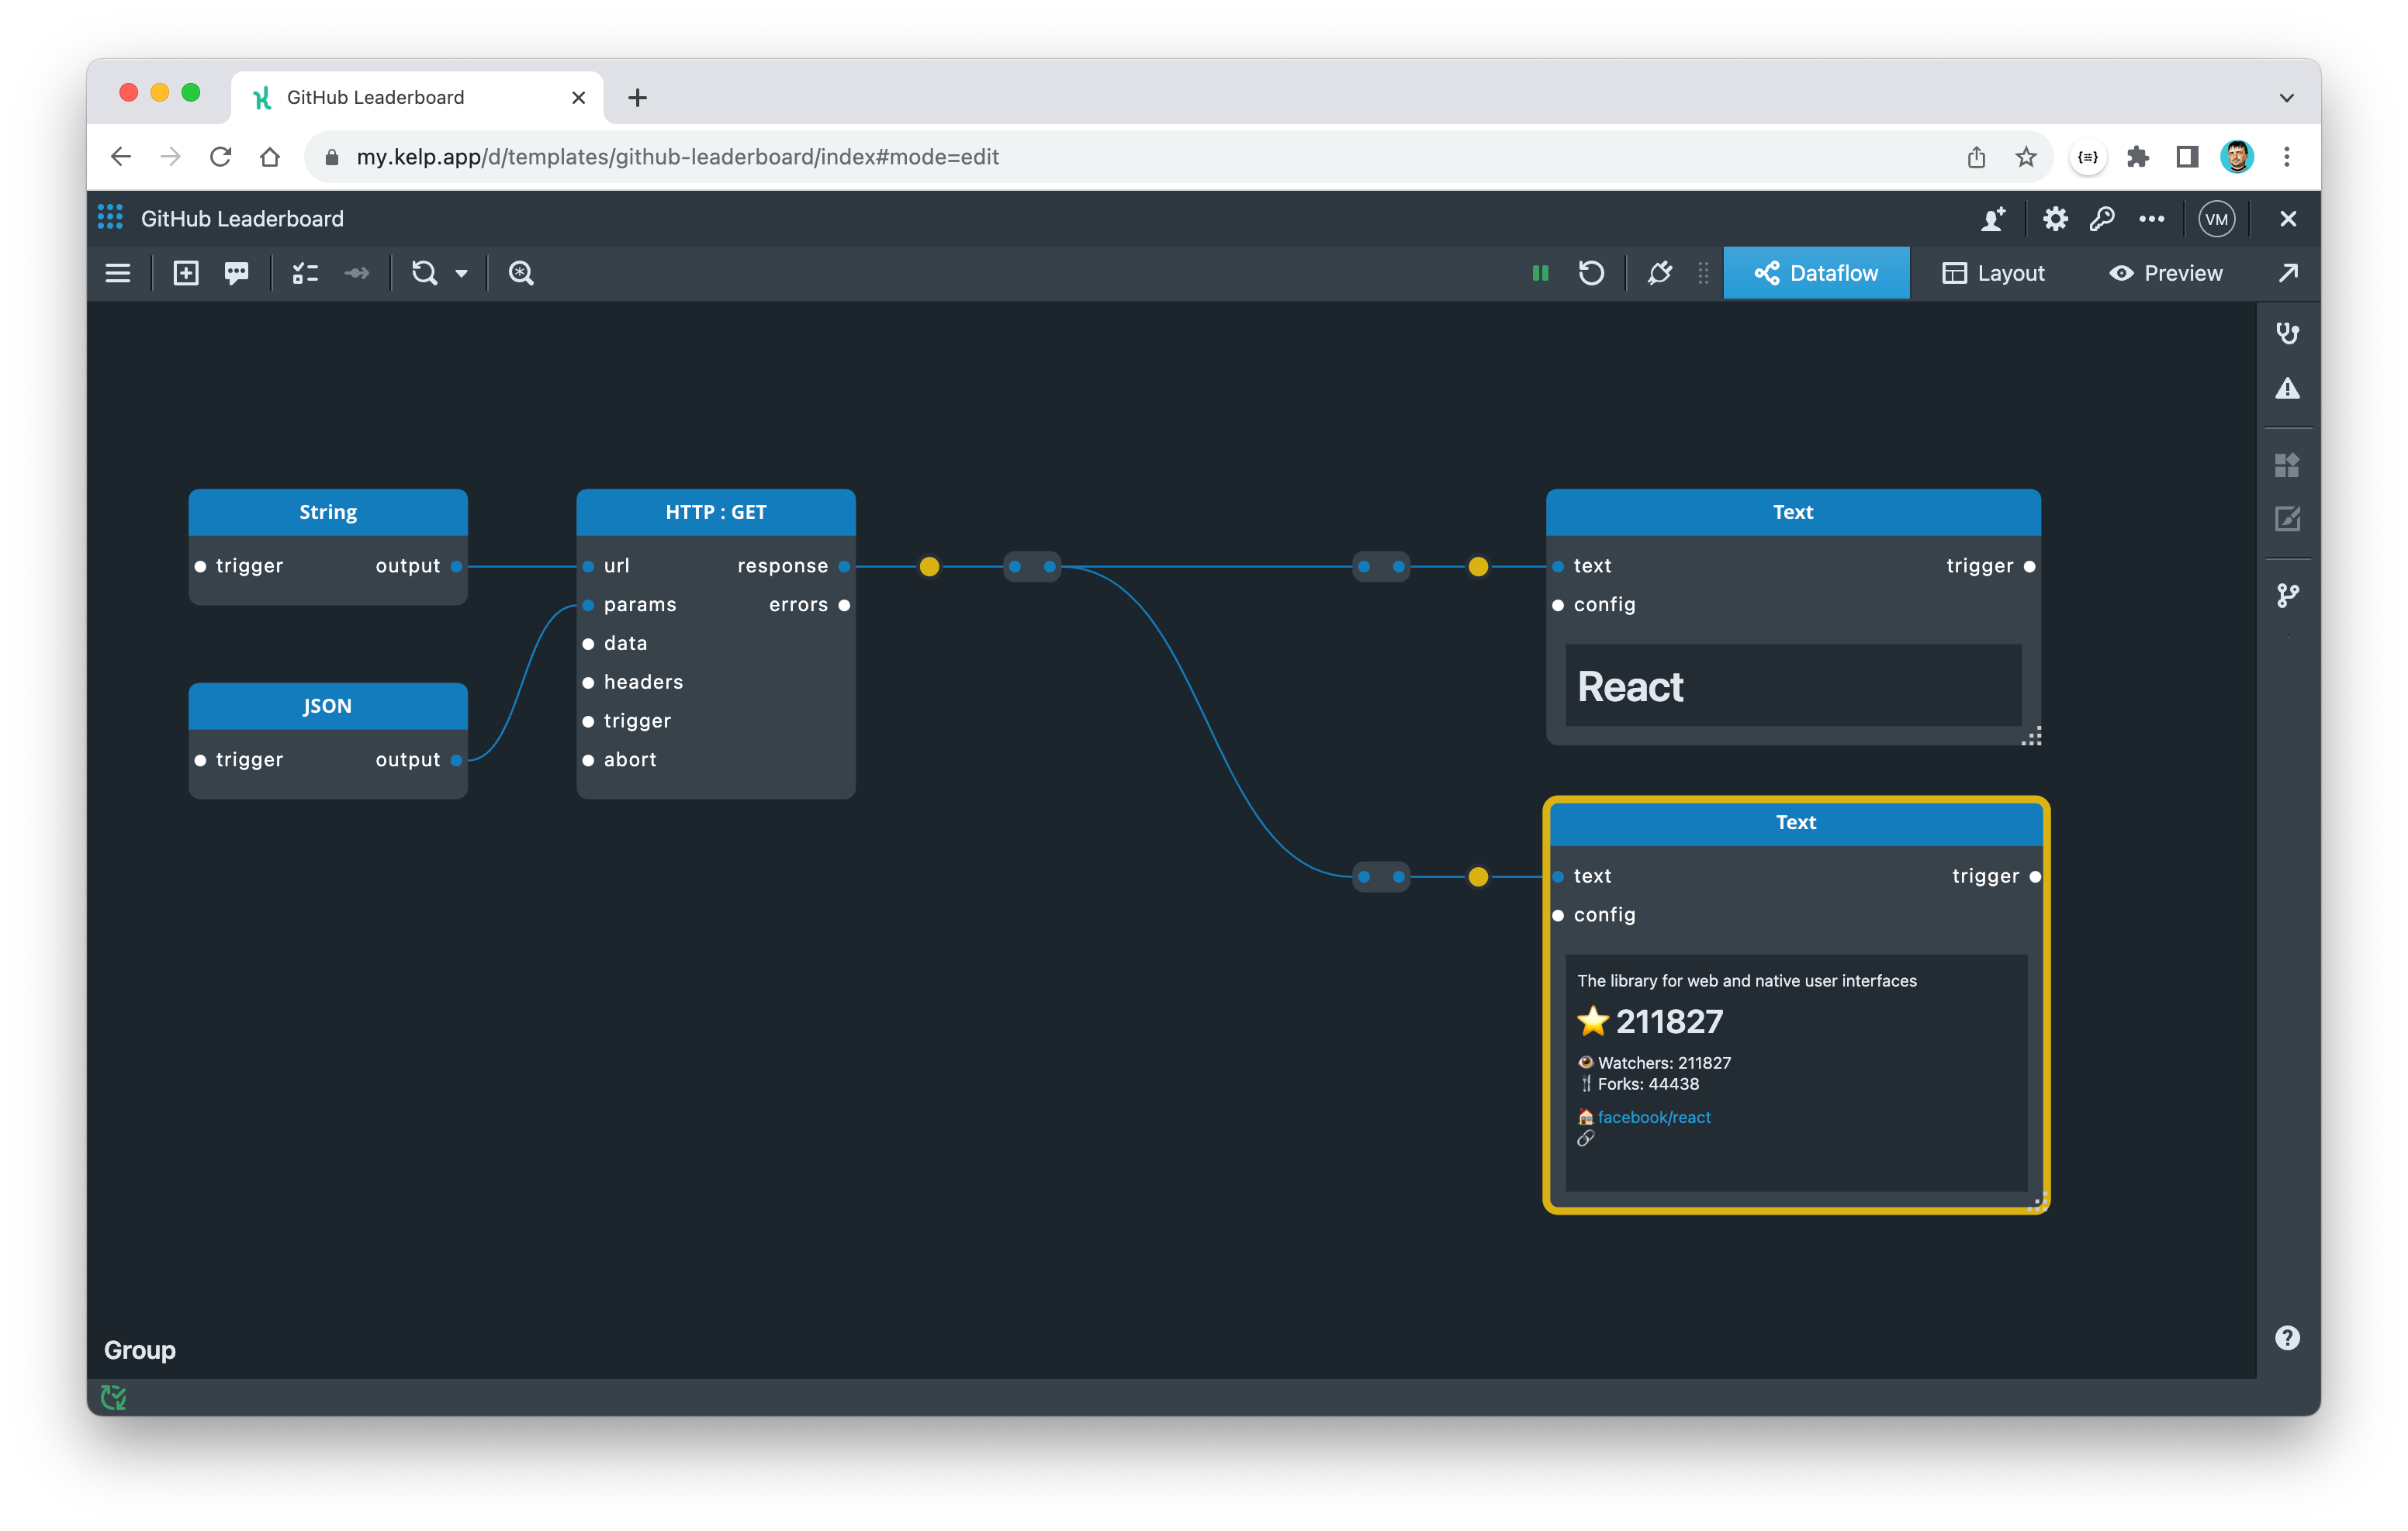
To display the repository description and summary of stats, you can repeat the same steps as before:
- Add a Text widget and connect its
textport to the transformed output from the HTTP component. - Apply the following transformation on the wire to the Text widget.
template('{{description}}

## ⭐️ {{stargazers_count}}

👁 Watchers: {{watchers_count}}
🍴 Forks: {{forks}}

🏠 [{{owner.login}}/{{name}}]({{html_url}})
🔗 [{{documentation}}]({{documentation}})
', @)
- Expand the Text widget.
- Restart the app.
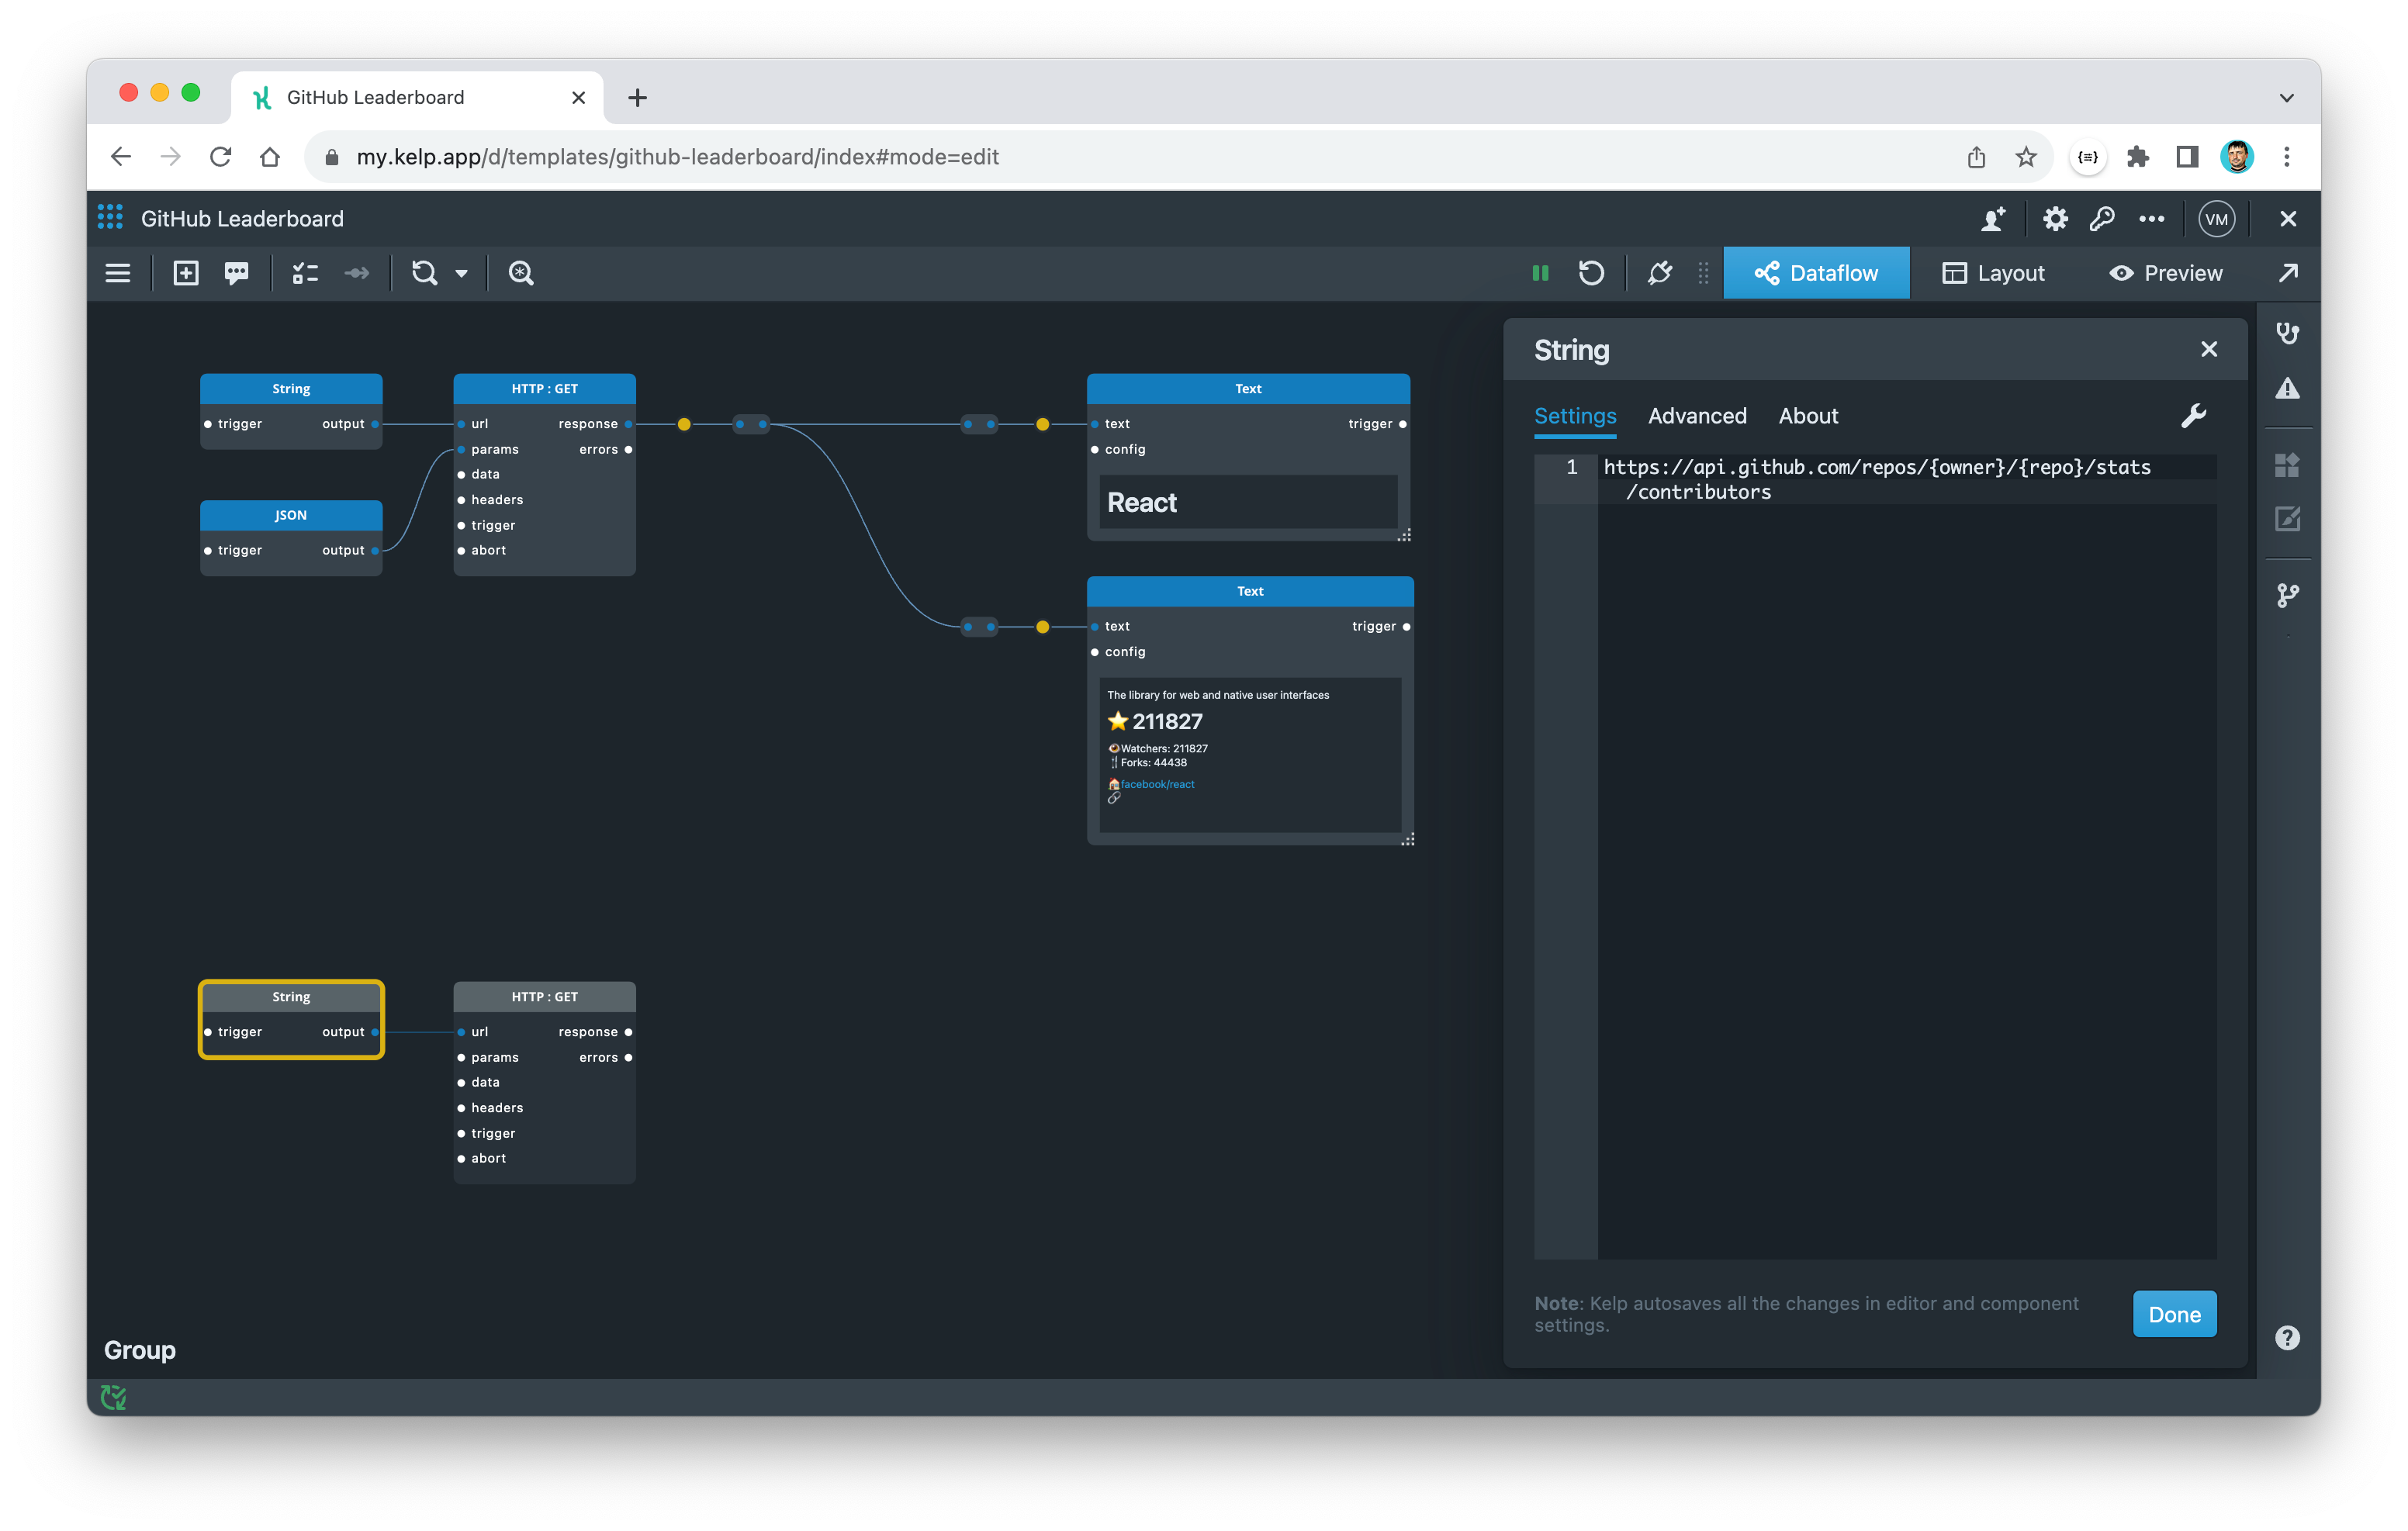
3. Display list of contributors
To display the top list of contributors, you need to fetch data from the All contributor commit activity API endpoint.
- Add an HTTP component.
- Add a String constant and connect its
outputport to theurlport of the HTTP component. - Open the settings dialog of the String constant and enter the URL of the new endpoint:
https://api.github.com/repos/{owner}/{repo}/stats/contributors
In Kelp, you can connect multiple wires to the output port. Each wire will transmit a copy of the events emitted from that port. Rather than adding a new JSON constant with parameters for the connector, you can reuse the one previously defined.
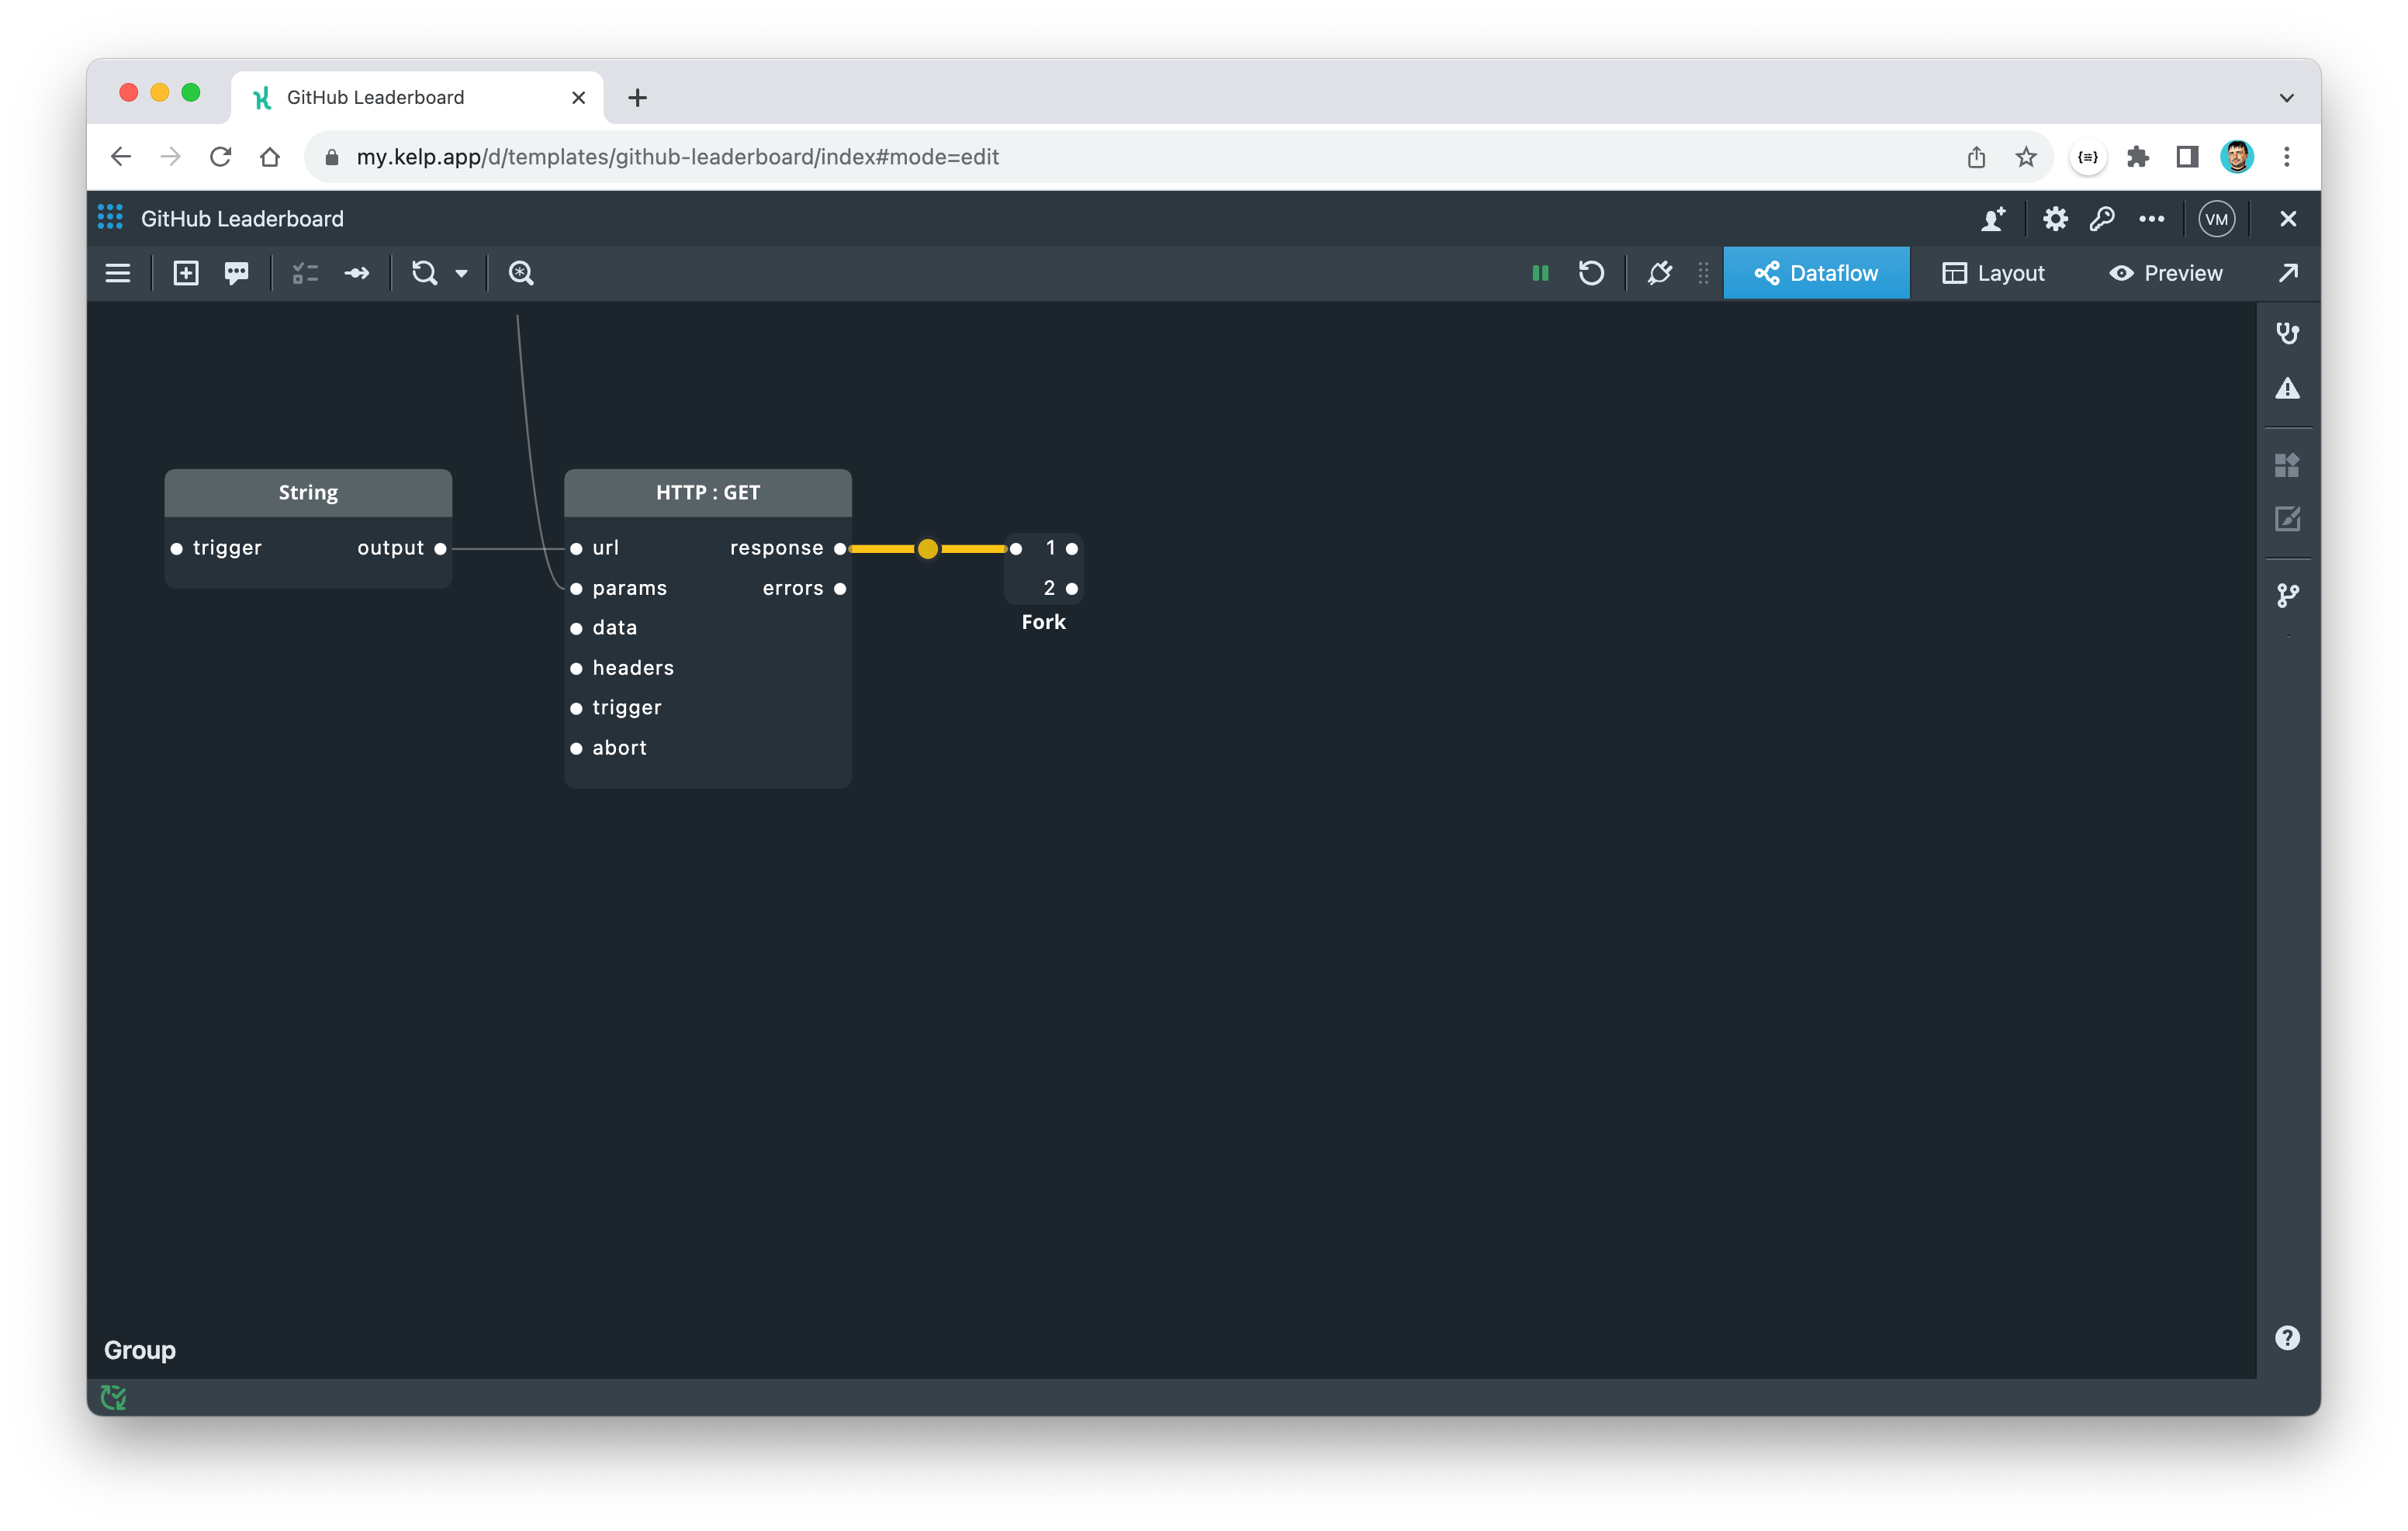
The next step is to add the same "unwrapping" transformation that was done for the previous connector. In this case, use the Fork component instead of the Port component, as it will be needed later.
To add the transformation:
- Add a Fork component and connect it to the
responseport of the HTTP connector. - Select the wire and add a transformation with the following expression:
data
To display a top list of contributors, you can use a List widget. This widget allows you to display an ordered list of entities with an overlayed bar chart, which is exactly what we need for our leaderboard. To pre-calculate all the necessary values for the overlay bars automatically, we can use a List Adapter component.
To set up the List Adapter component, follow these steps:
- Add the List Adapter component and connect it to the transformed output from the HTTP component.
- Open the settings dialog of the List Adapter and input the following values:
- ID Field:
id - Display Field:
id - Click + to add a metric
- Metric Field:
total - Metric Name:
Commits - Convert Values: Number to Locale String
- ID Field:
- Apply the following transformation on the wire between the Fork and the List Adapter components:
[*].{
  id: author.login
  total: total
}
| order_by(@, 'total', 'desc')
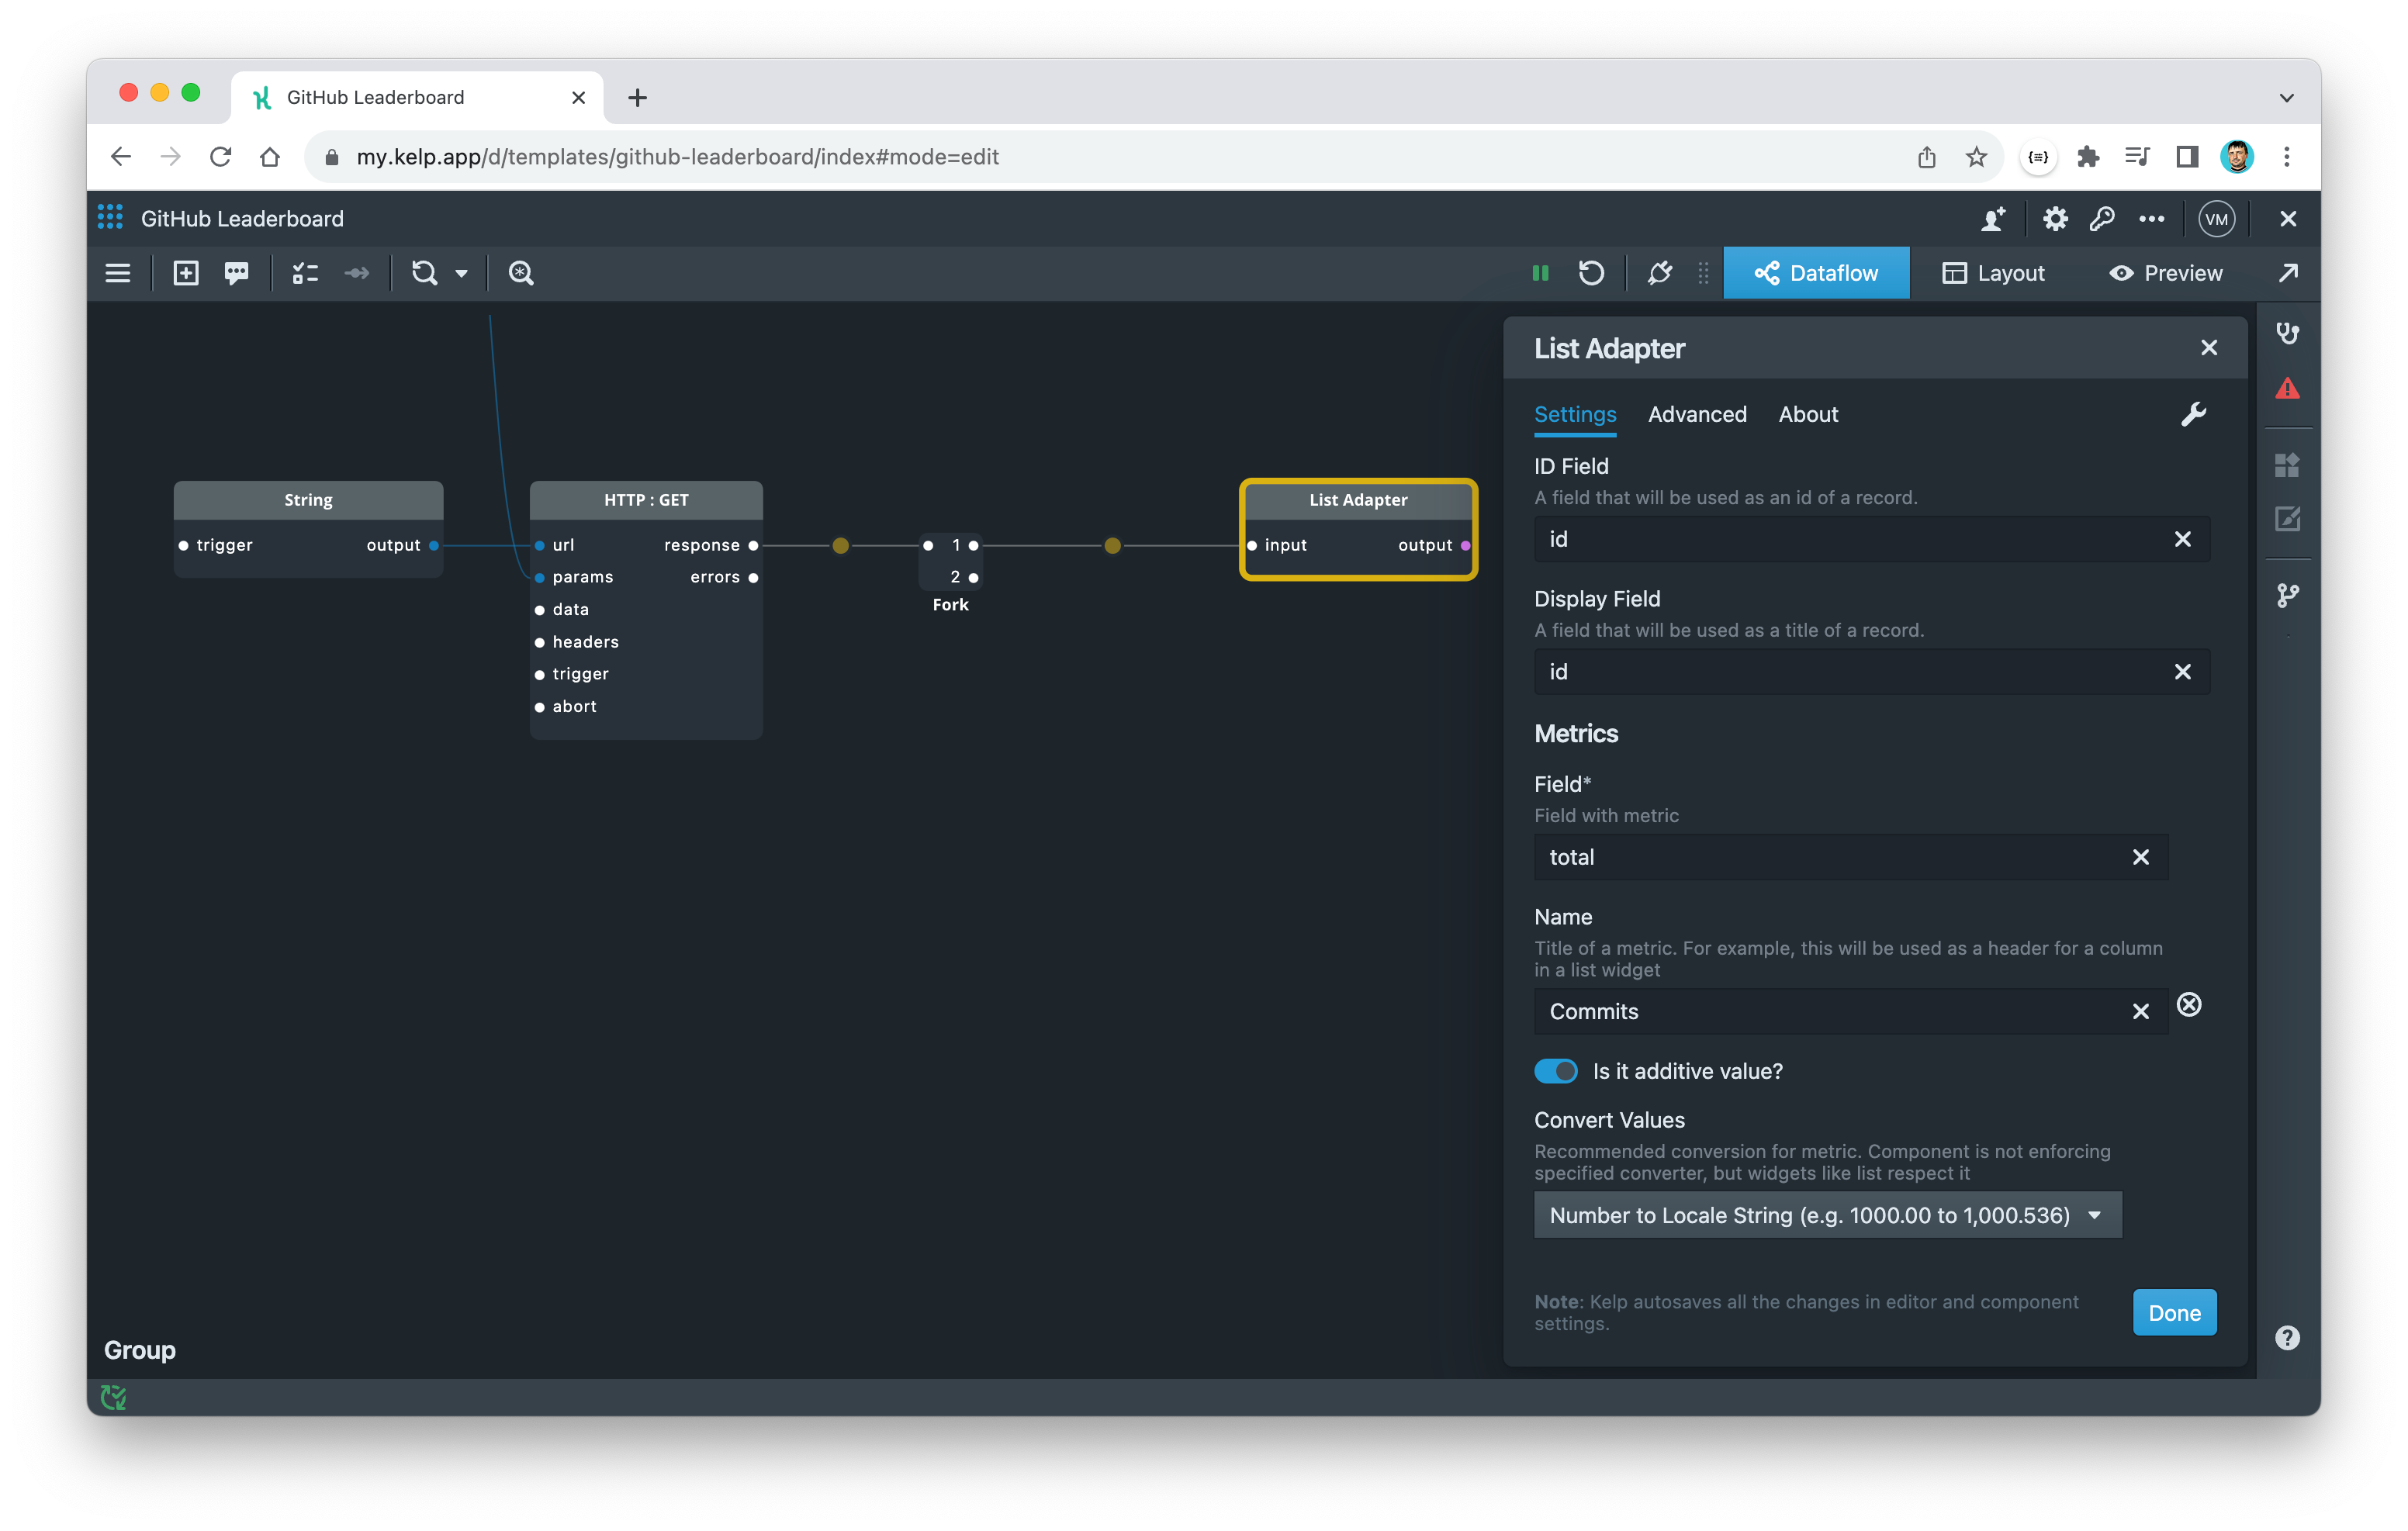
The KelpQL expression above transforms an array of contributor objects into a new array of objects with id and total properties. This new array is then sorted in descending order by the total property.
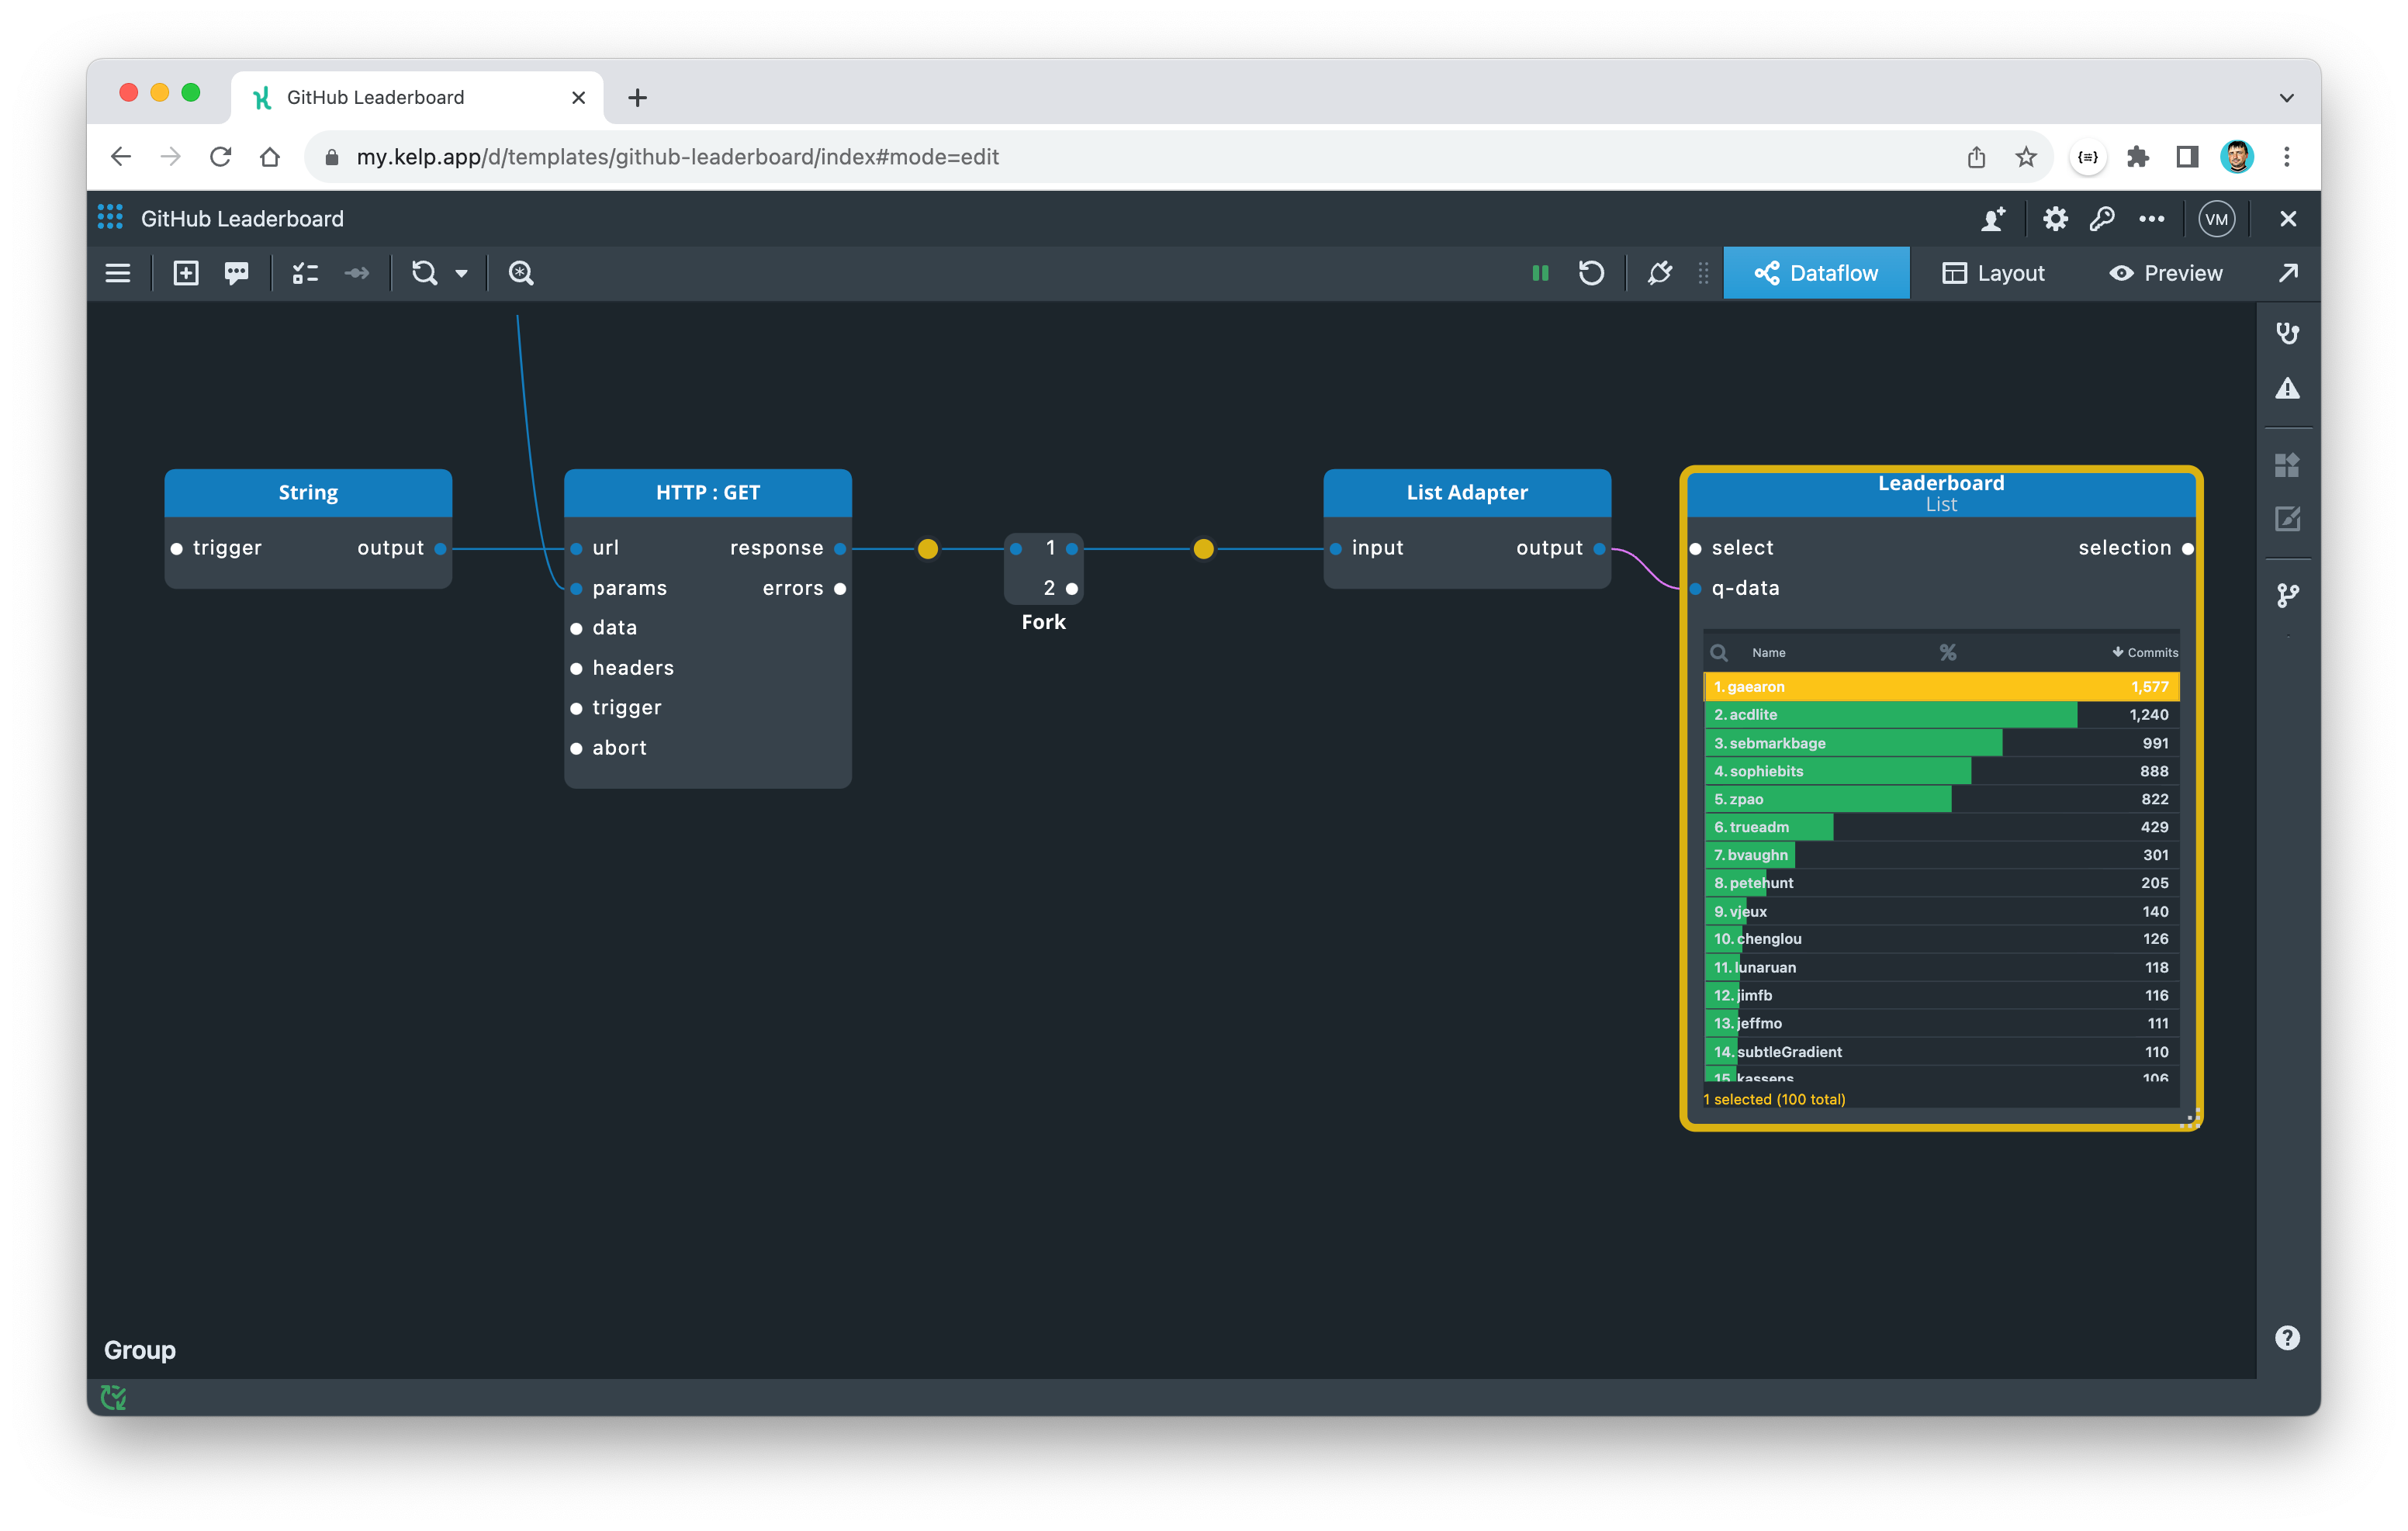
To continue, connect a List widget:
- Add a List widget and select it.
- Open the Settings dialog and set the "Require selection of an entry?" property to
yes. This will help us select the top contributor upon loading. - Connect the
outputport of the List Adapter component to theq-dataport of the List widget. - Expand the List widget.
- Restart the app.
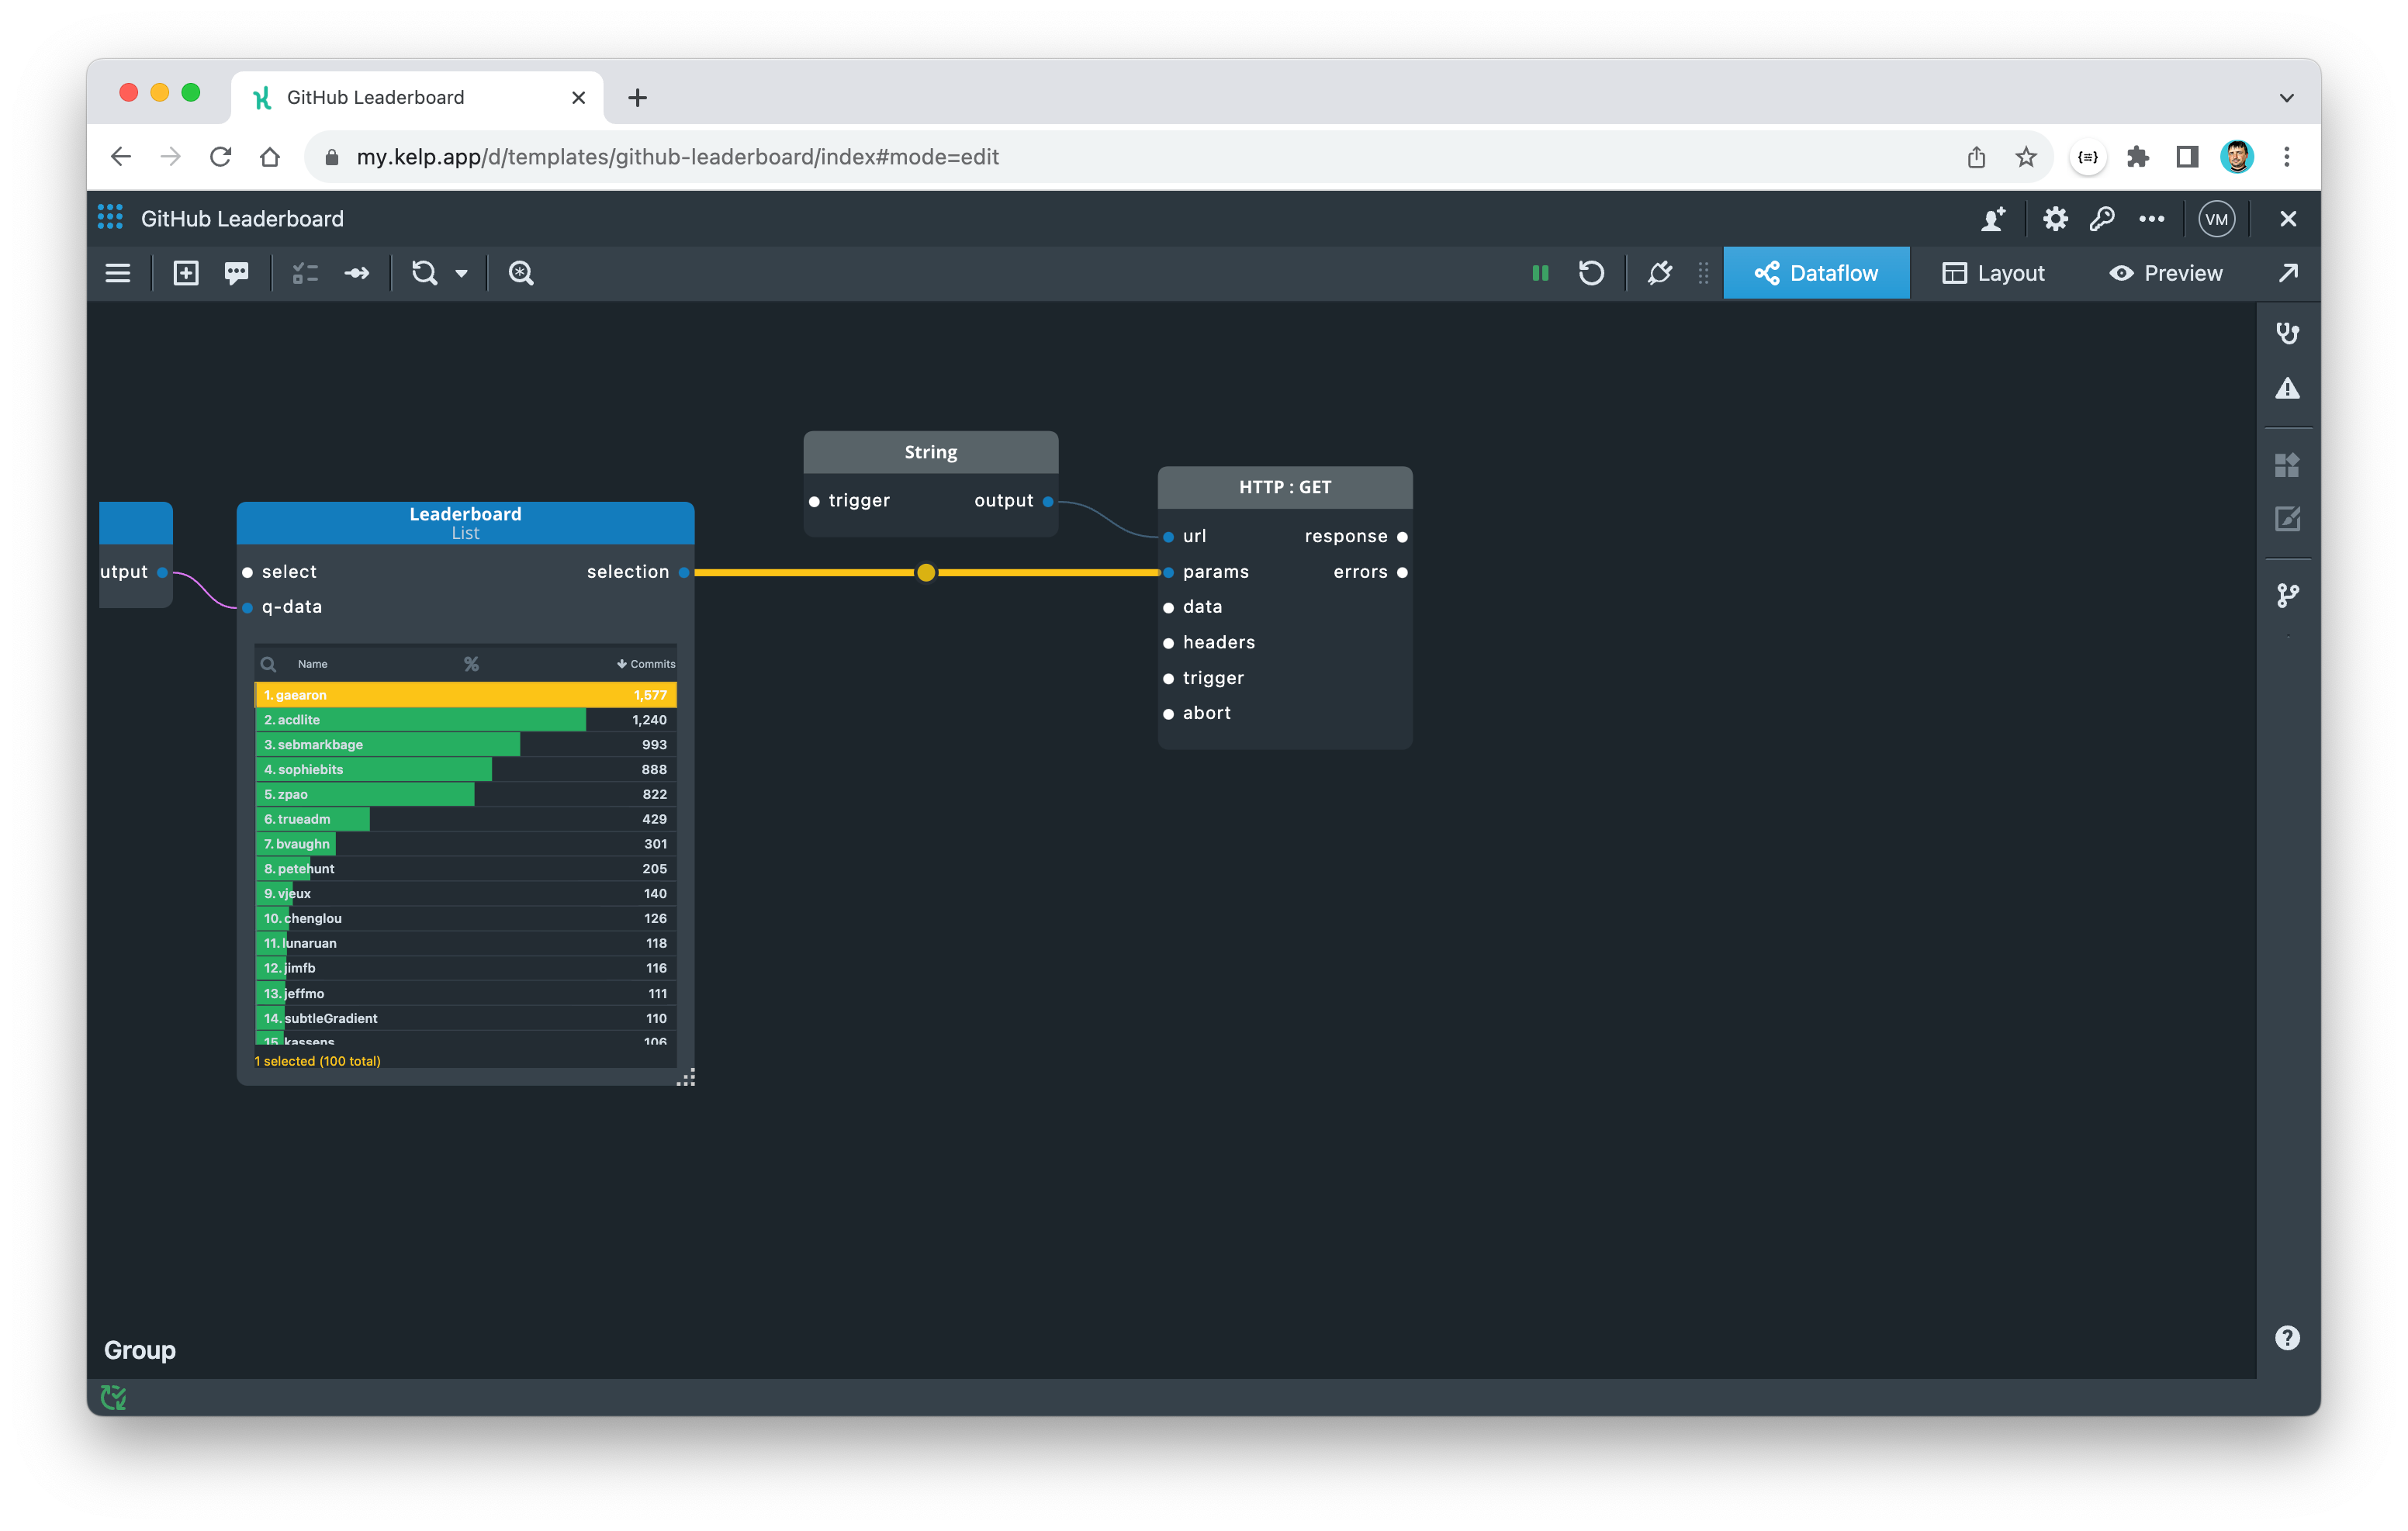
4. Display contributor profile
Let's add an interactive feature to the dashboard. When a contributor is selected from the top list, their details will be displayed as a summary card with their profile picture and contact information.
The List widget will emit an event from the selection port every time an item in the list is selected. The selection object will have an id property, which we previously defined as the login of the contributor. We can use this property to send another API request to the Get a user endpoint to retrieve publicly available information about the GitHub user with that account.
Adding and configuring HTTP component in the similar way you did before:
- Add HTTP component with
GETmethod andNo Authauthentication - Add String constant and connect its
outputport to theurlport of the HTTP component. - Setf the String constant value to the URL of the new endpoint:
https://api.github.com/users/{login}
- Connect
selectionport of List widget to theparamsport of the HTTP component - Select the wire and add a transformation with the following expression:
{
  login: [0]
}
The KelpQL expression above extracts the first element from the selection event and assigns it as the value of the login parameter.
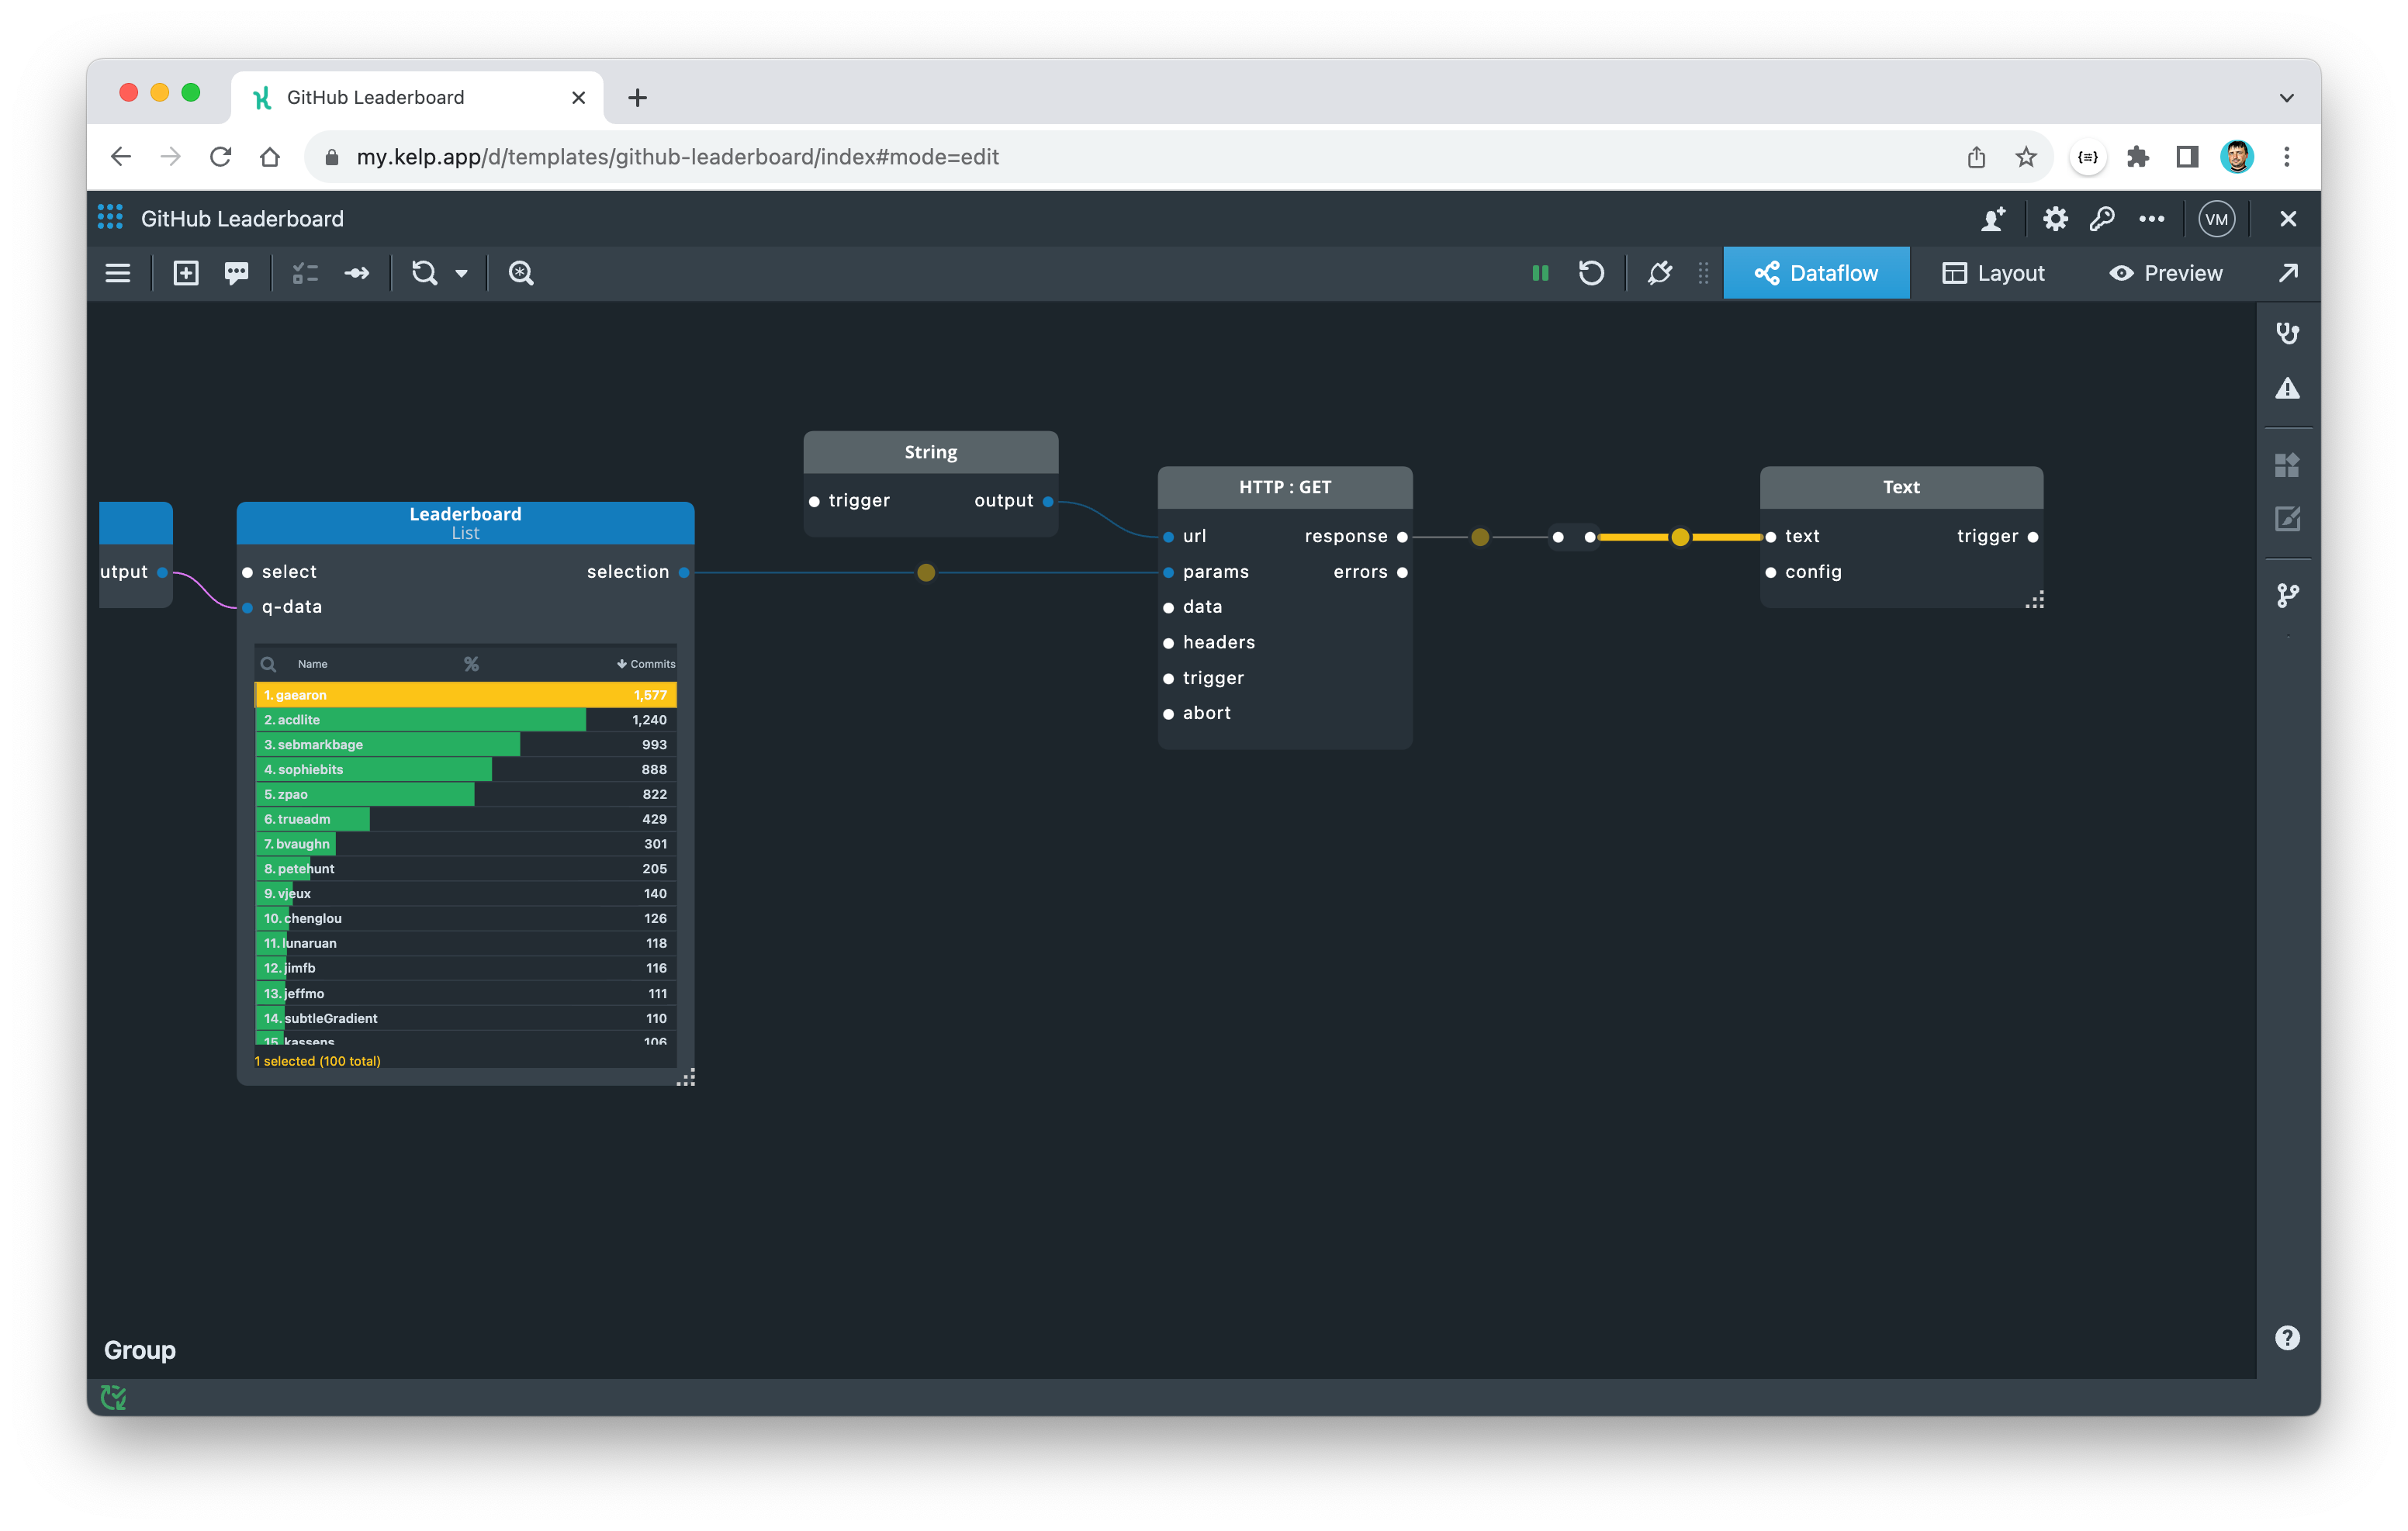
Do the "unwrapping" transformation on the response port of the HTTP component:
- Pull out a Port component from the
responseport of the HTTP connector. - Select the wire and add a transformation with the following expression:
data
- Add Text widget and connect its
textport to the transformed output from the HTTP component - Select the wire and add a transformation with the following expression:
template('

## {{name}}
{{login}}
{{bio}}
[{{followers}} followers]({{followers_url}}) · [{{following}} following]({{following_url}})
🏠 [{{company}}](https://github.com/{{company}})
🔗 [{{blog}}](https://{{blog}})
[@{{twitter_username}}](https://twitter.com/{{twitter_username}})
',@)
The KelpQL expression above will take the current context (the response object), find various properties such as avatar_url, name, login, bio, followers, etc. in it, and substitute it into the markdown template string.
- Expand the List widget.
- Restart the app.
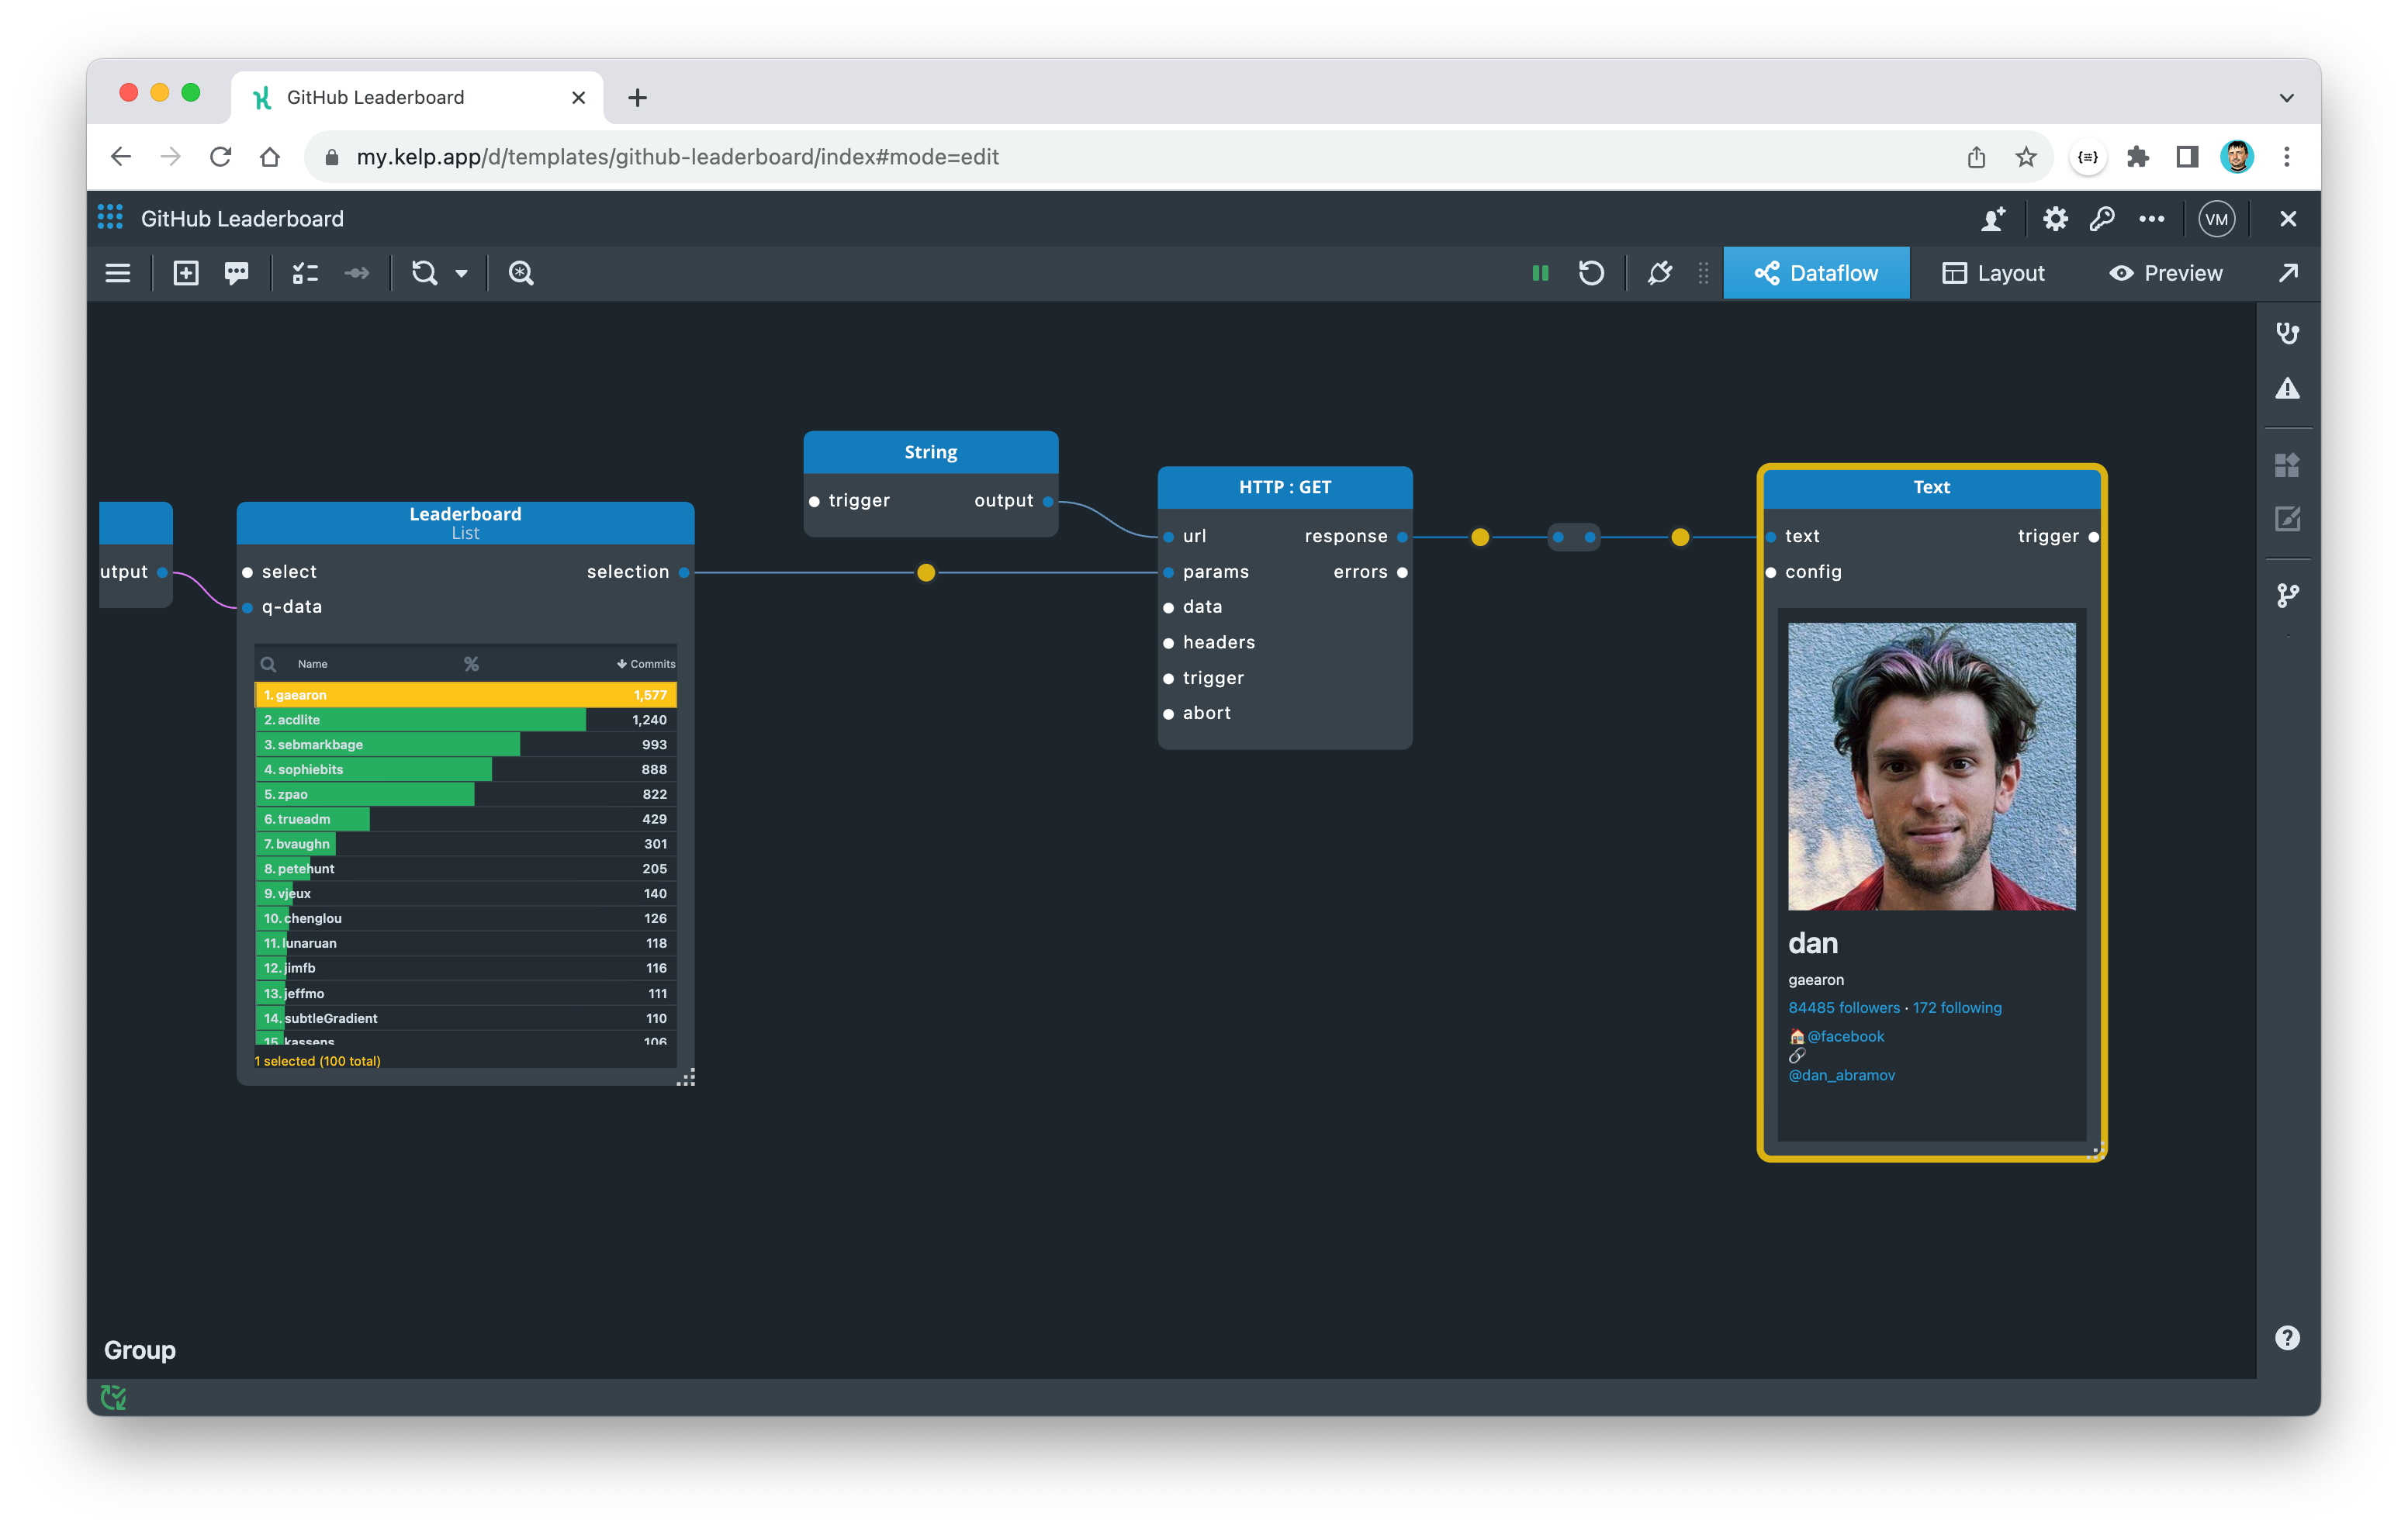
As the contributors List is now connected to the contributor profile Text widget, selecting a different contributor in the list automatically updates the profile. Try selecting a different contributor from the List!
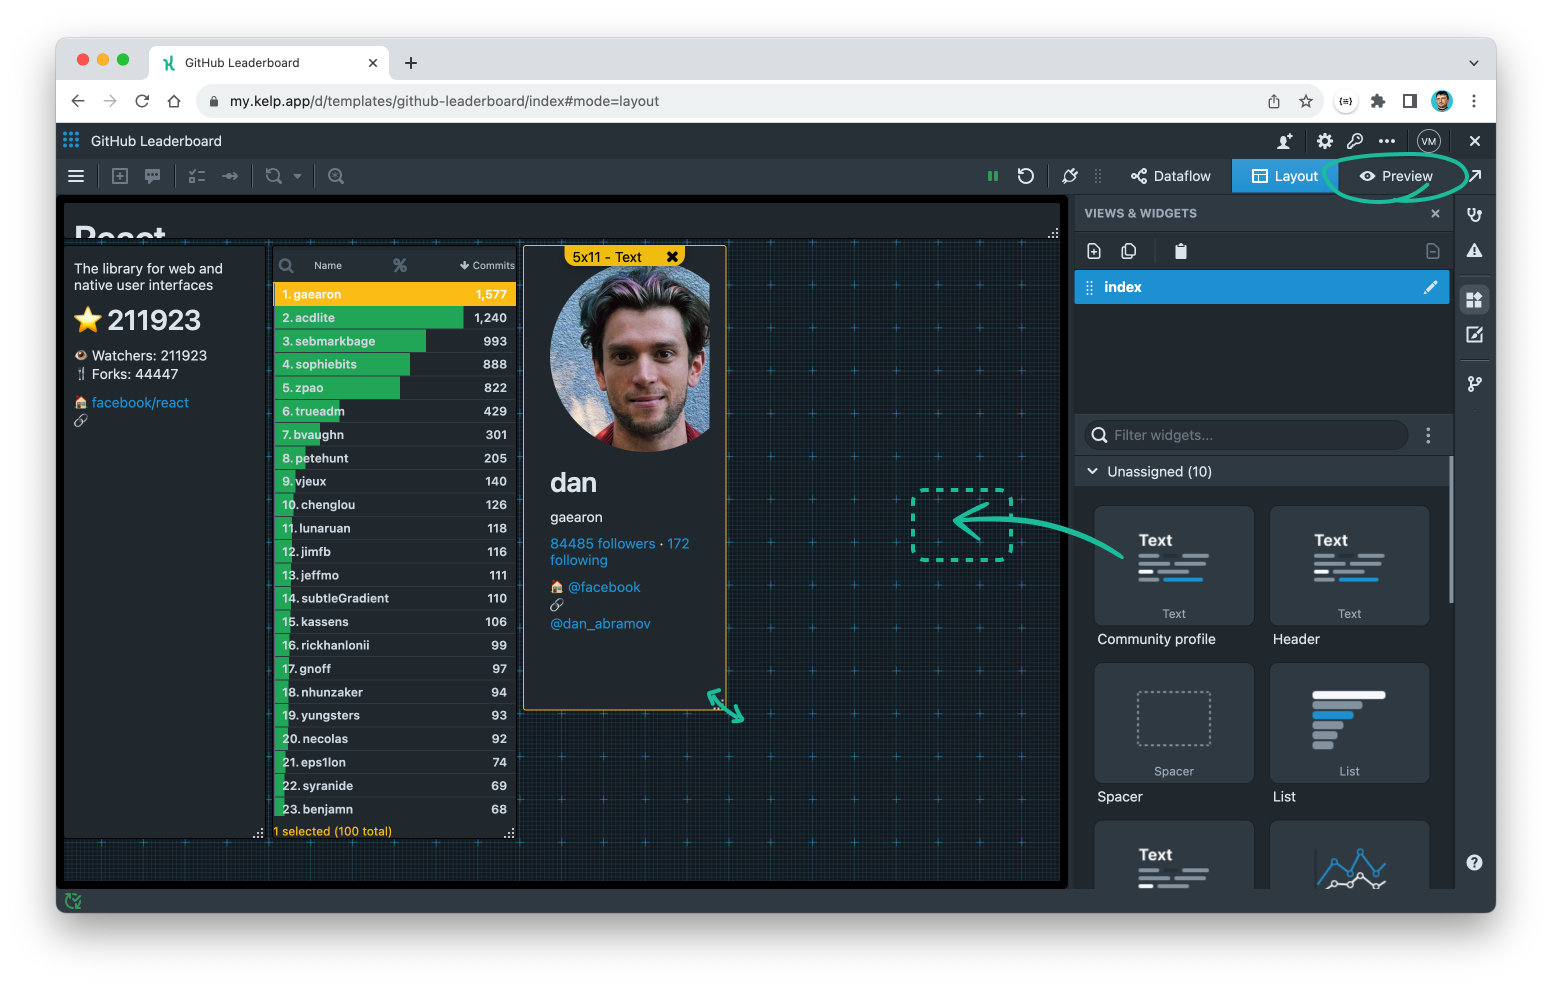
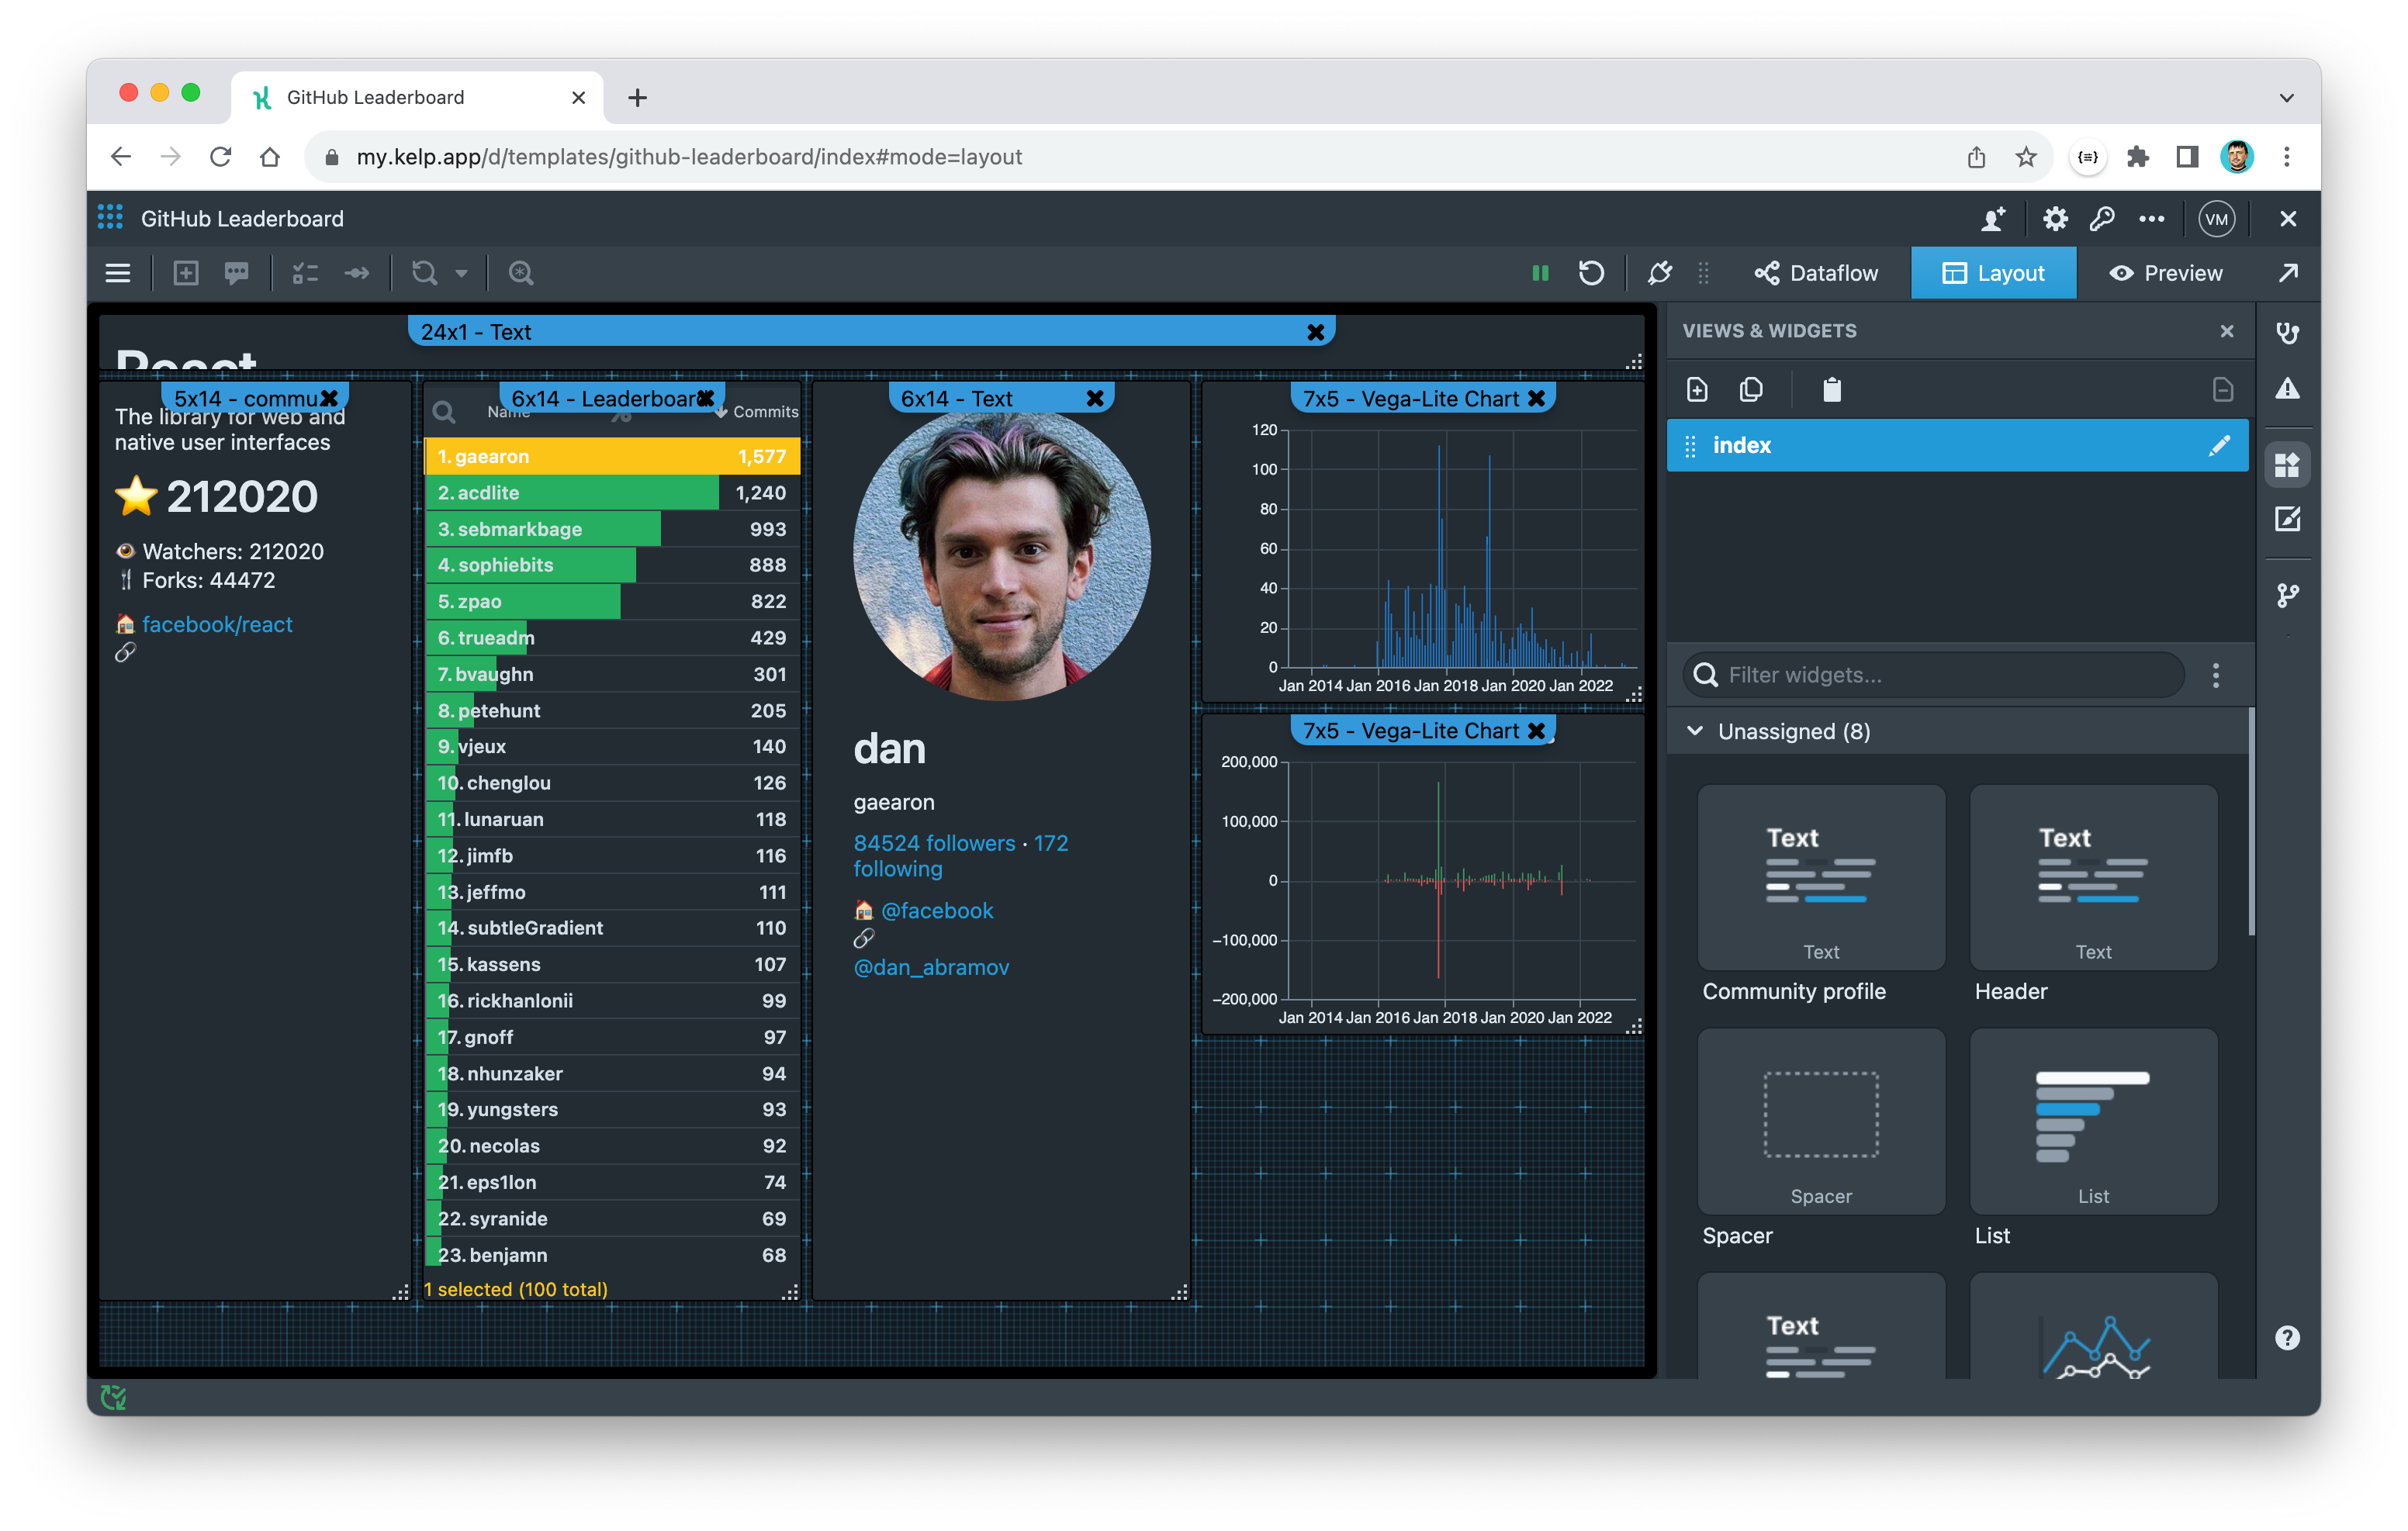
5. Design the layout
Once all of your widgets are set up and connected, it's time to finalize and add them to the layout. Switch to Layout mode and drag and drop your widgets from the WIDGETS panel onto the layout. Position and resize them wherever you'd like. To resize the tiles on the layout, drag the bottom-right corner. At any time, switch to Preview mode to see how the final result looks.
Only widgets that were set up in the Dataflow canvas will appear in the WIDGETS panel. You can add the same widget to multiple views and group them by view or type.
Congratulations! You have built your first app using Kelp. Now, release and share it with your friends, coworkers, or even the whole world. Use the same steps to create many other custom apps using your own data.
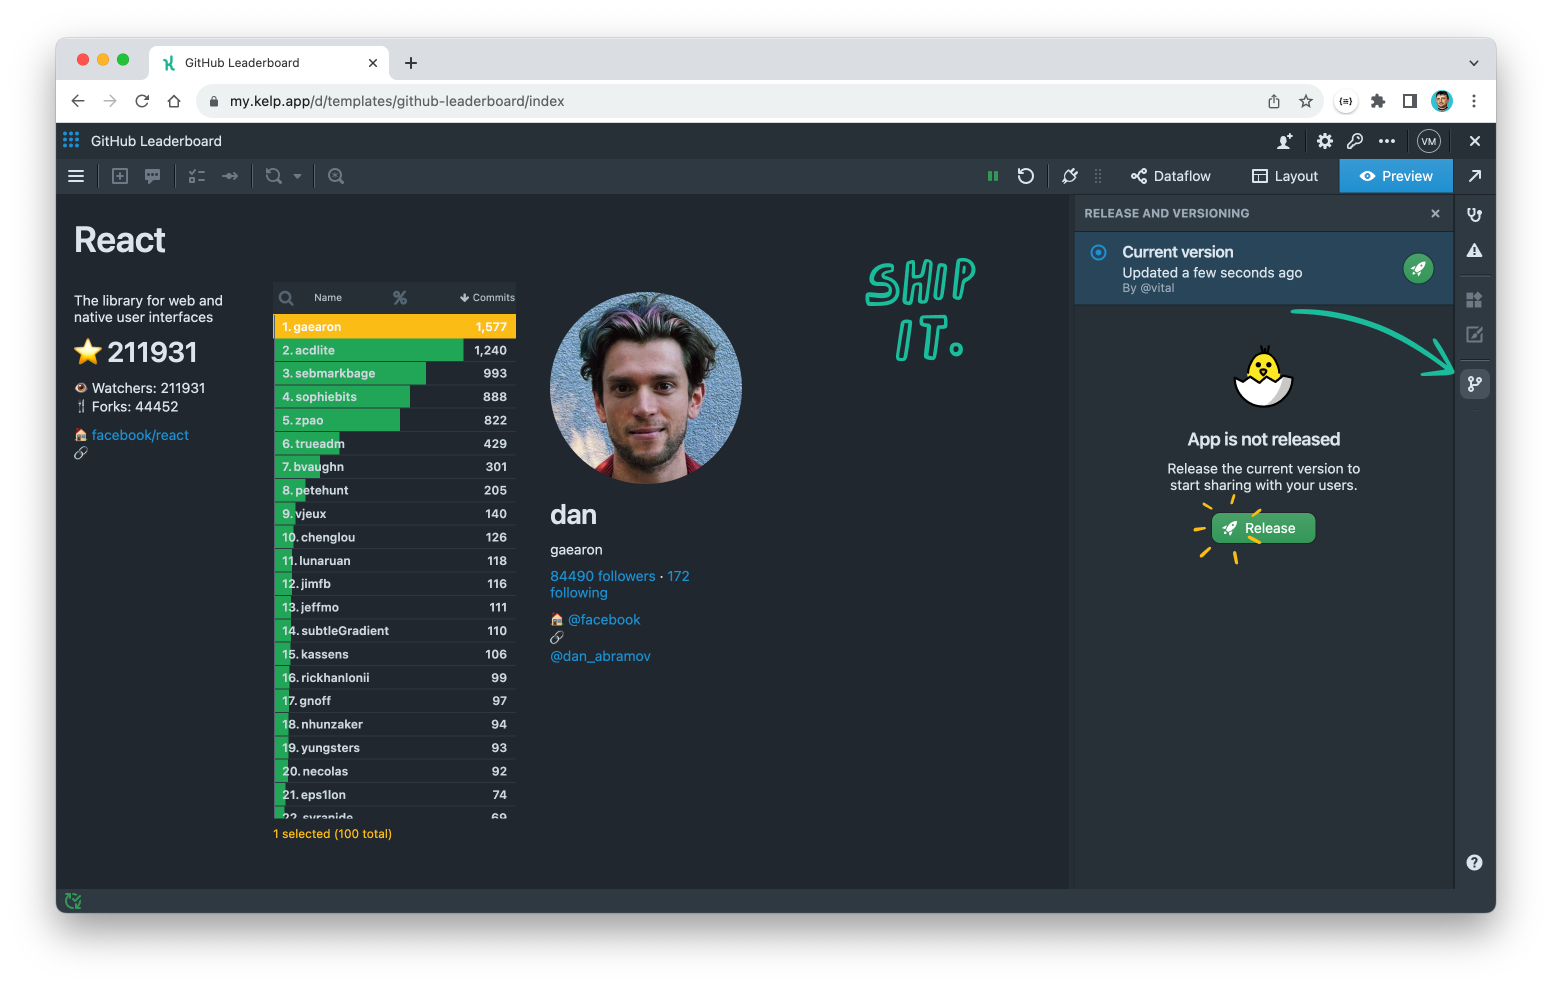
6. Release and share
You are now ready to release and share your first app:
- Open the release panel and click "Release."
- Confirm the release. At this step, you can also create a custom app slug.
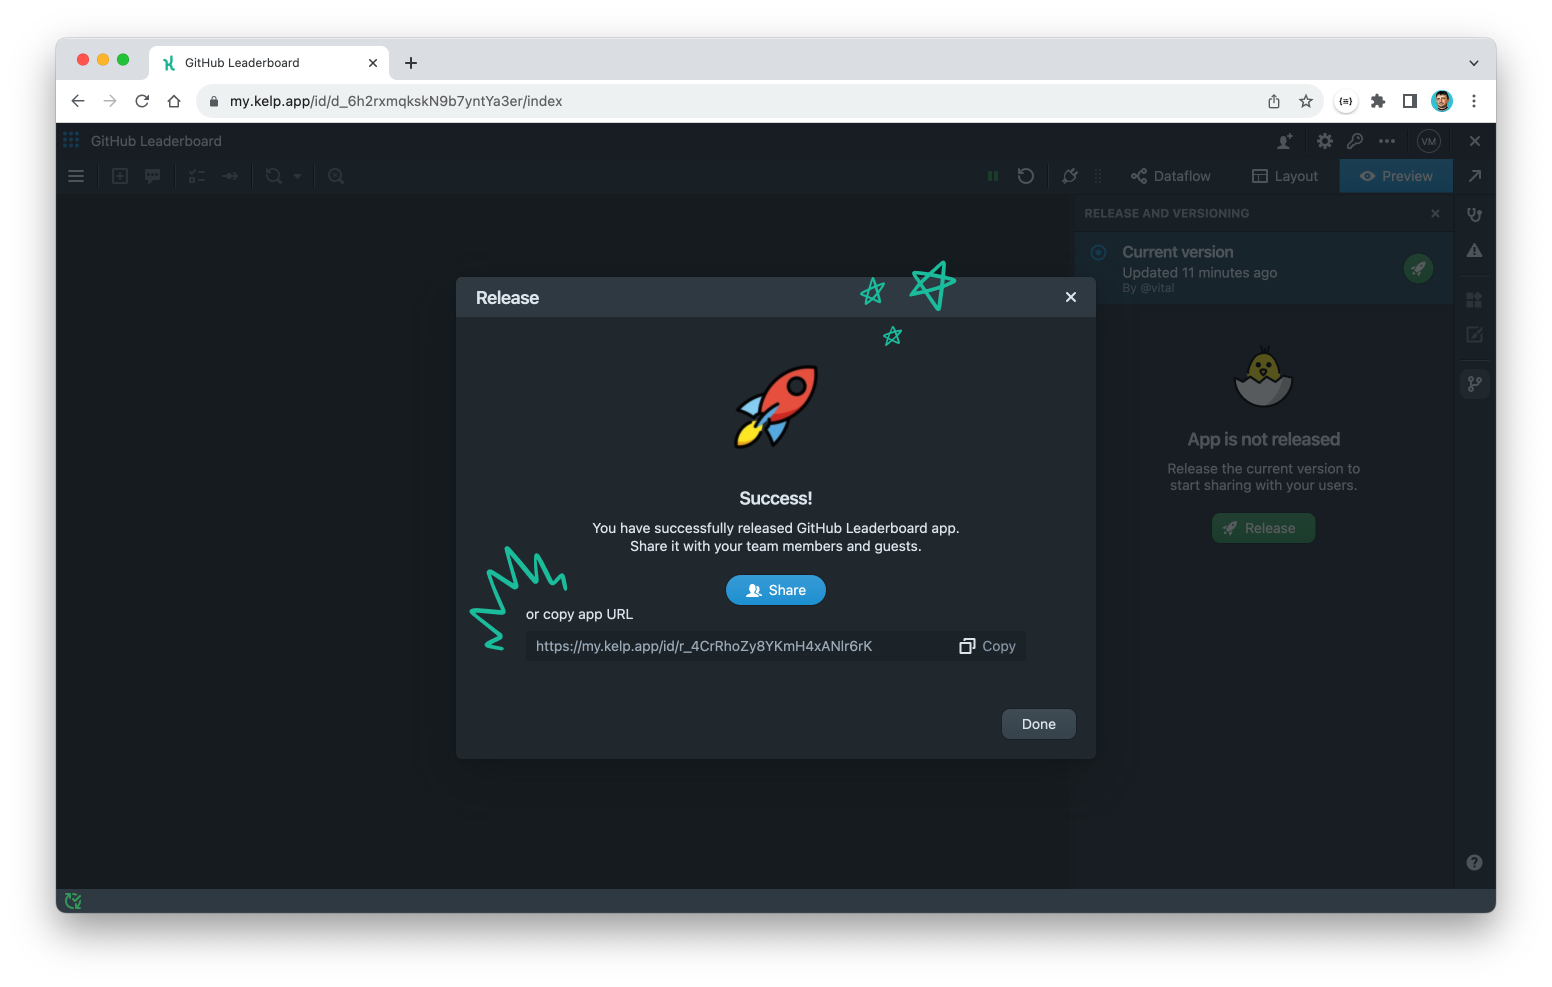
Grab the URL of the released app and share it with your coworkers via Slack or email. They can view the app once they sign up for Kelp and join your workspace.
7. Add charts (bonus)
Keep on building! 🔥 Let's add historical charts for contributor commits. You'll learn a few more tricks on how to create cool data apps. You've got this!
Weekly statistics for commits, additions, and deletions are included in the contributor dataset retrieved in the previous steps. This dataset is an array of contributor objects, and the stats data is a part of each object in the weeks property.
[
  {
    "author": {
      "login": "threepointone",
      "id": 18808
      ...
    }
    "total": 16,
    "**weeks**": [
      {
        "w": 1369526400,
        "a": 34,
        "d": 23,
        "c": 1234
      },
      ...
    ]
  },
  ...
]
To obtain the statistics for the currently selected contributor, you must first select the object from the array that corresponds to the selected contributor, and then retrieve the weeks property.
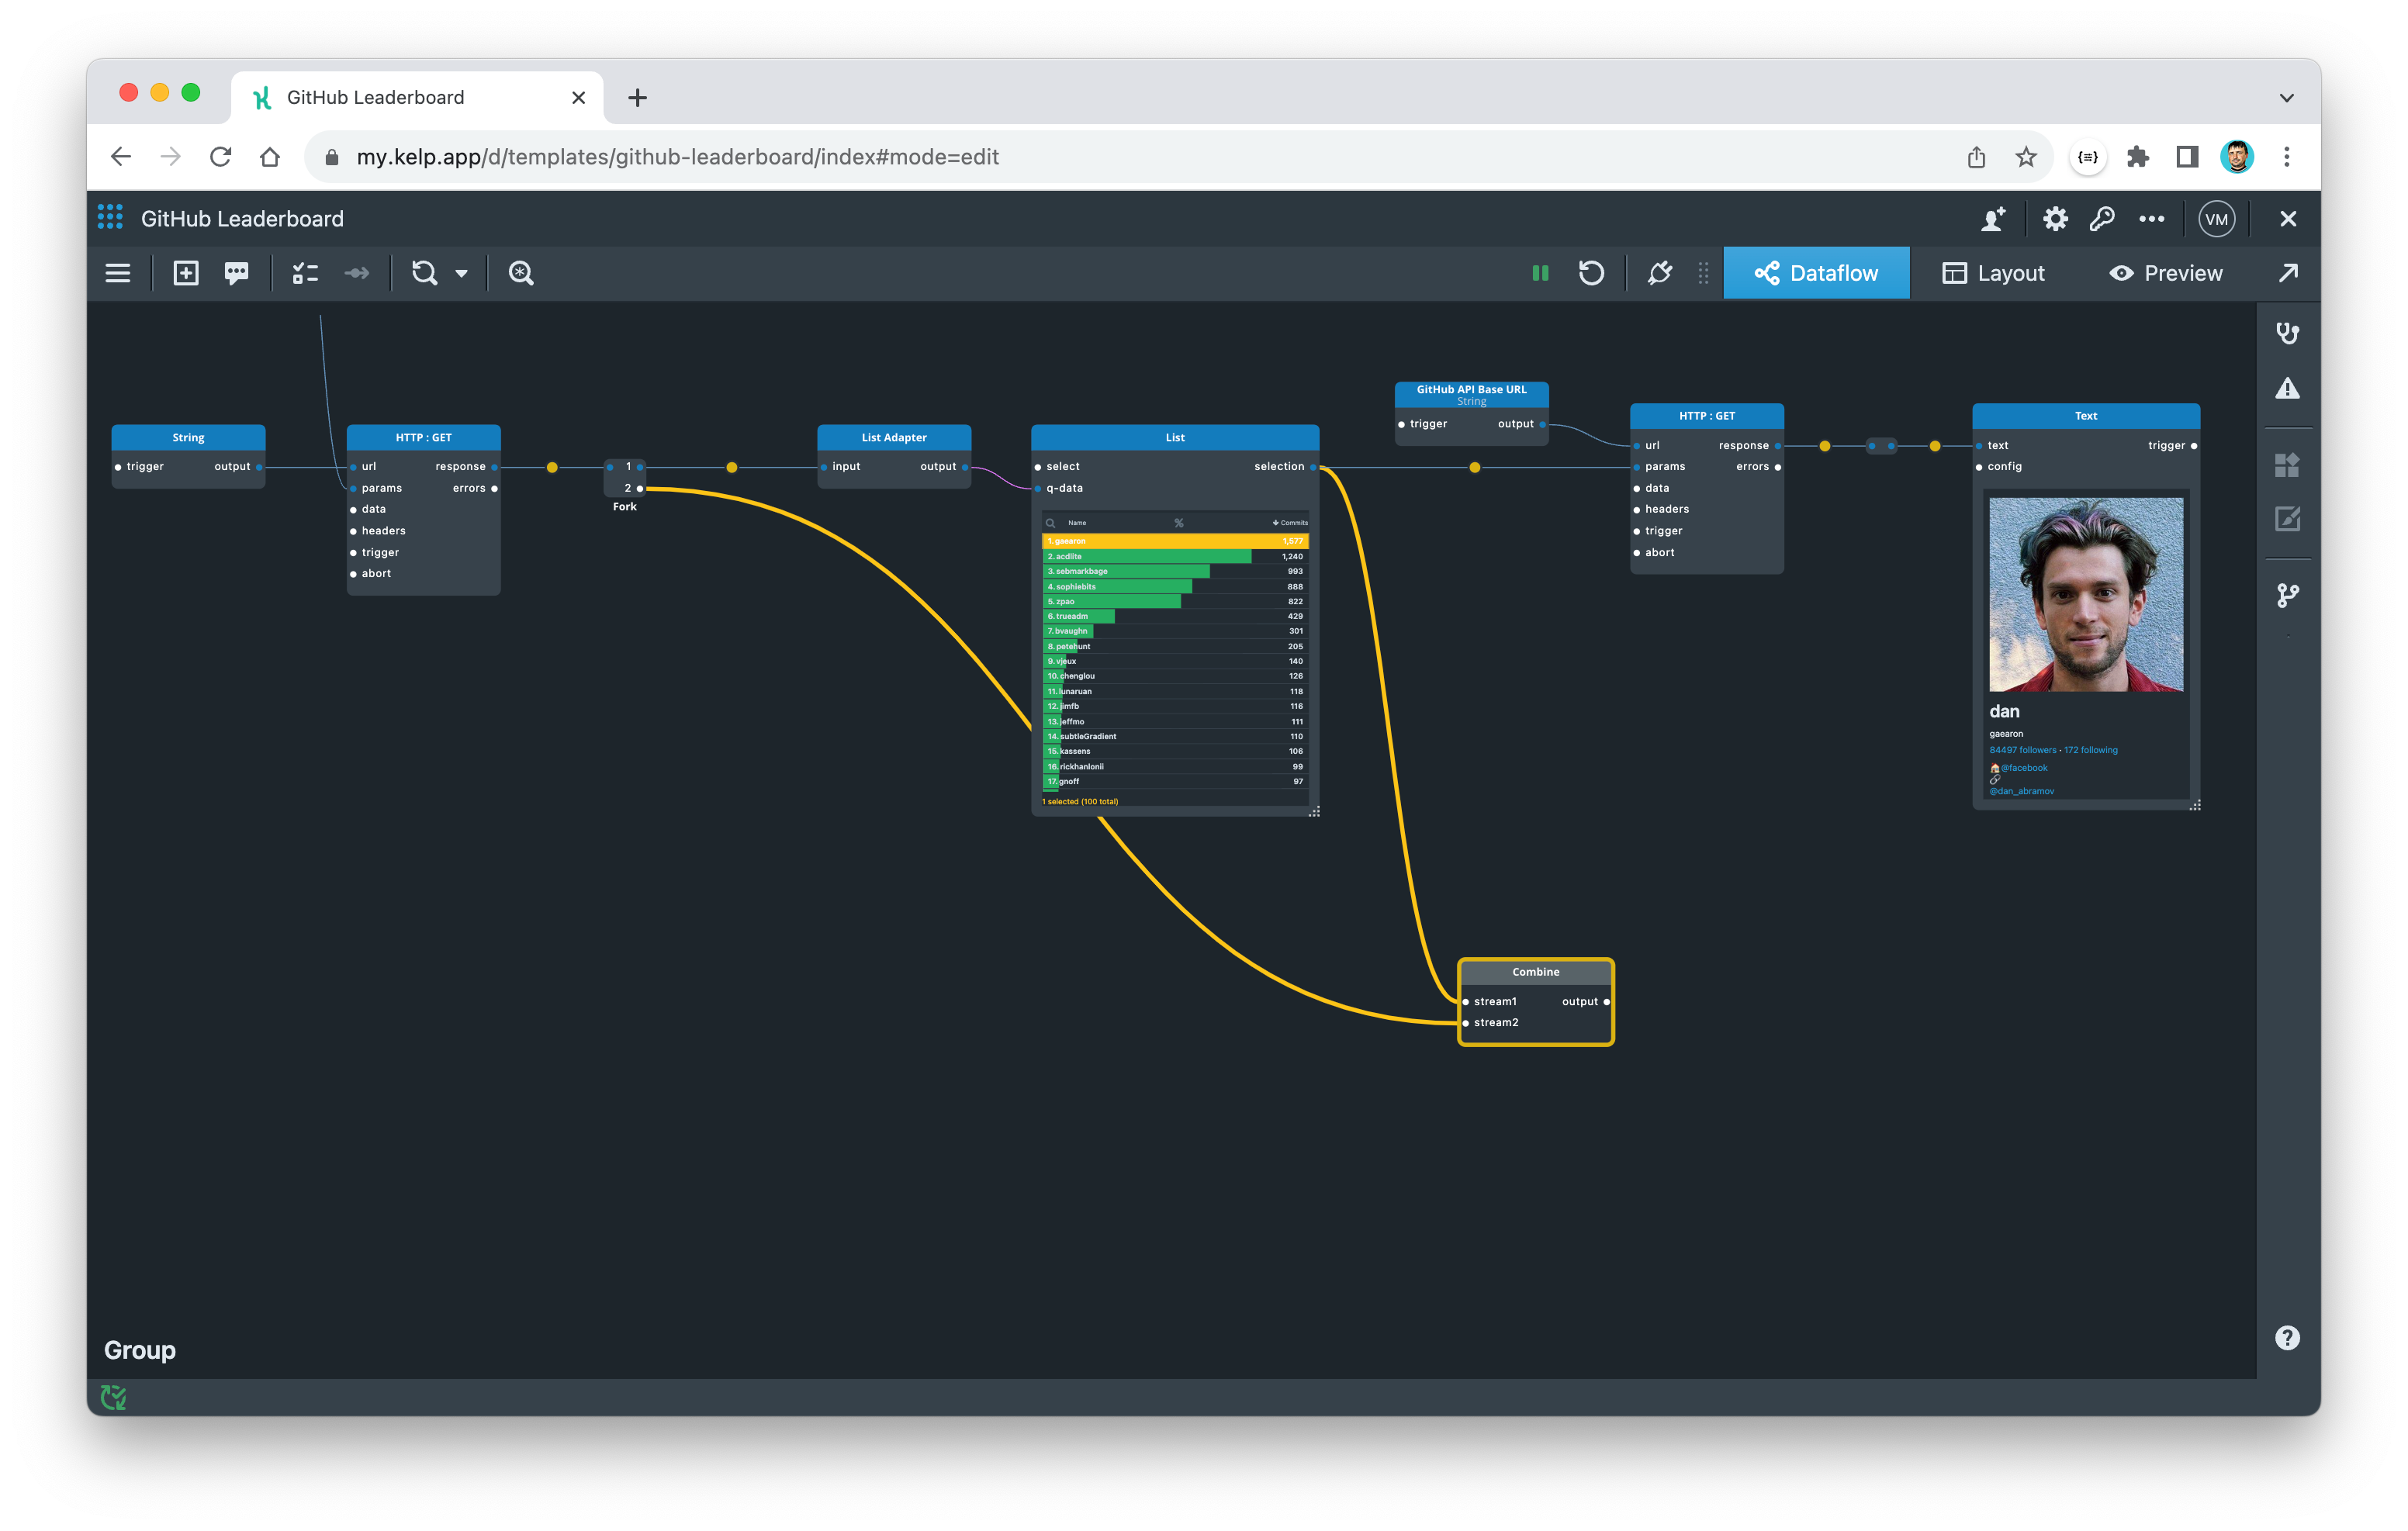
To do this, you need to combine the array of contributors event with the selection event from the List widget and then apply a transformation to extract the statistics.
Here are the steps to follow:
- Add a Combine component.
- Connect the
selectionport of the List widget to thestream1port of the Combine component. - Connect the output of the Fork component to the
stream2port of the Combine component.
To apply the transformation, first pull out a Port component from the output port of the Combine component. Then, add the following transformation expression to the wire:
find([1],
  {
    author: {
      login: [0][0]
    }
  }
).weeks
| map(@, &set(value, 'date', mul(value.w, 1000)))
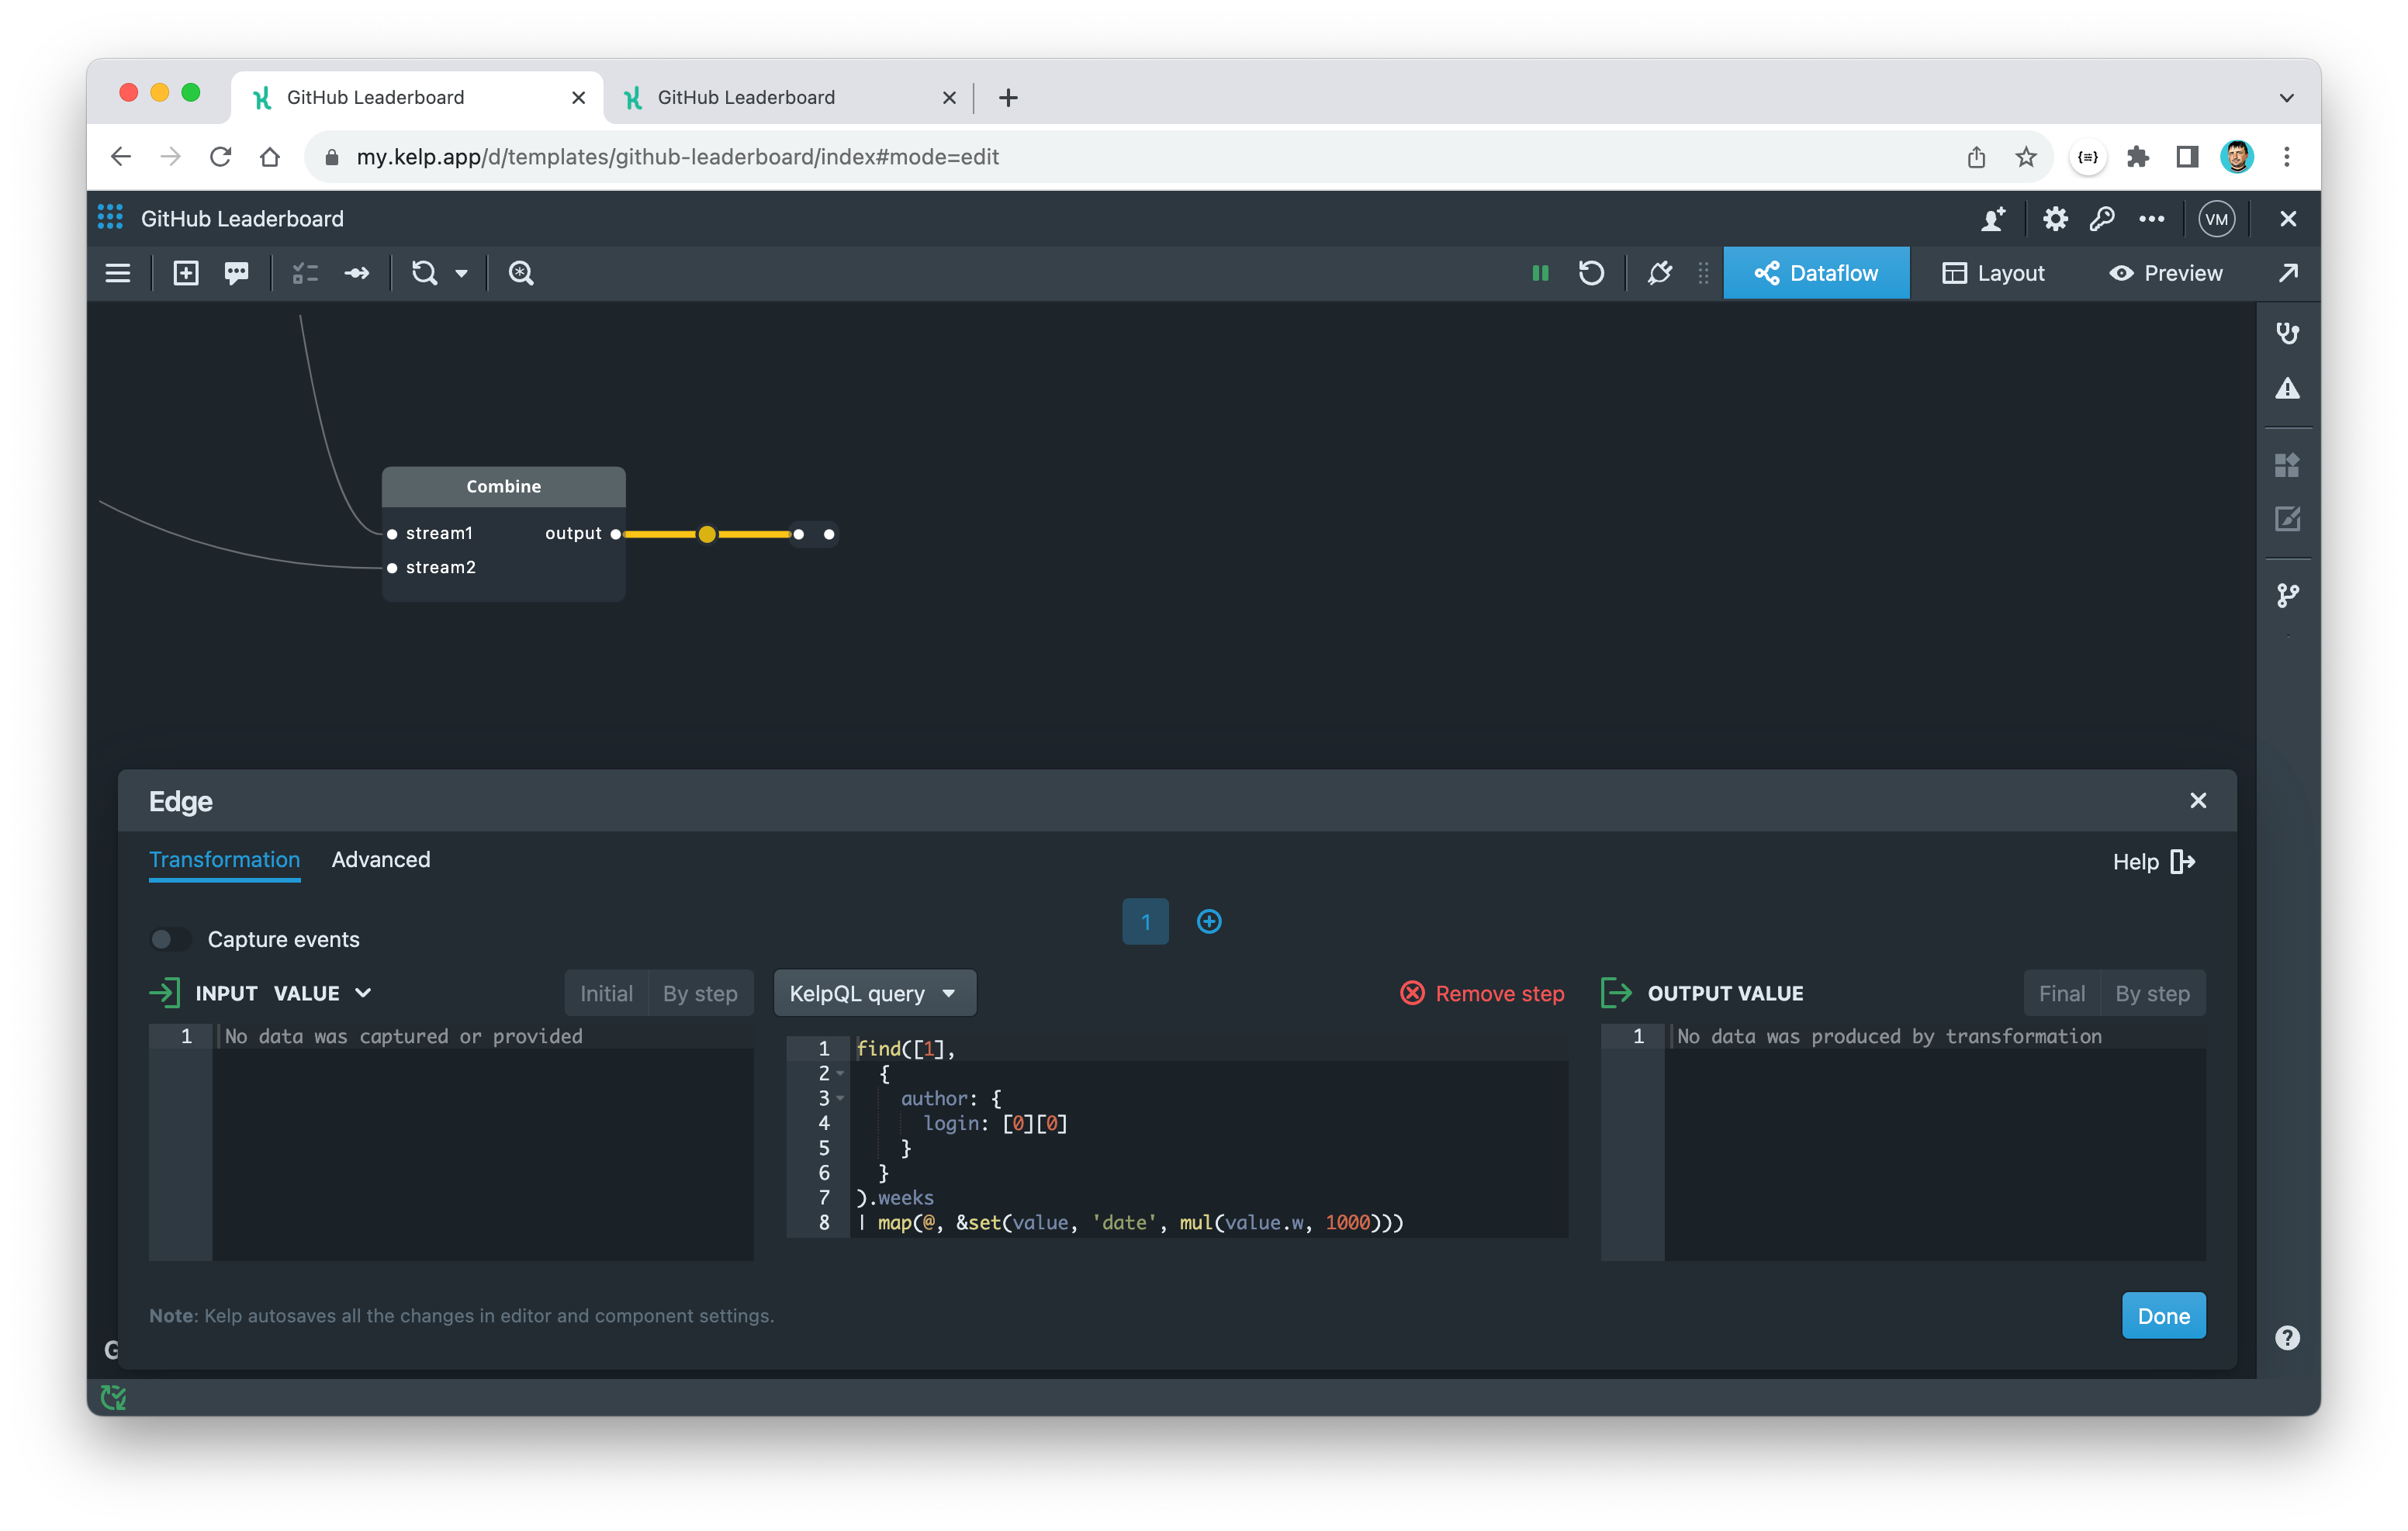
The KelpQL expression above performs a series of operations on a combined JSON array:
find([1], {author: {login: [0][0]}}).weeks: This expression searches for an object in the contributors array that matches the login name in the List widget selection. If it finds a match, it retrieves theweeksproperty of that object.| map(@, &set(value, 'date', mul(value.w, 1000))): This expression iterates over each element in theweeksarray retrieved from the previous step. For each element, it multiplies thewproperty by1000to convert Unix timestamp format to JavaScript time format used by Kelp and Vega-Lite charts.
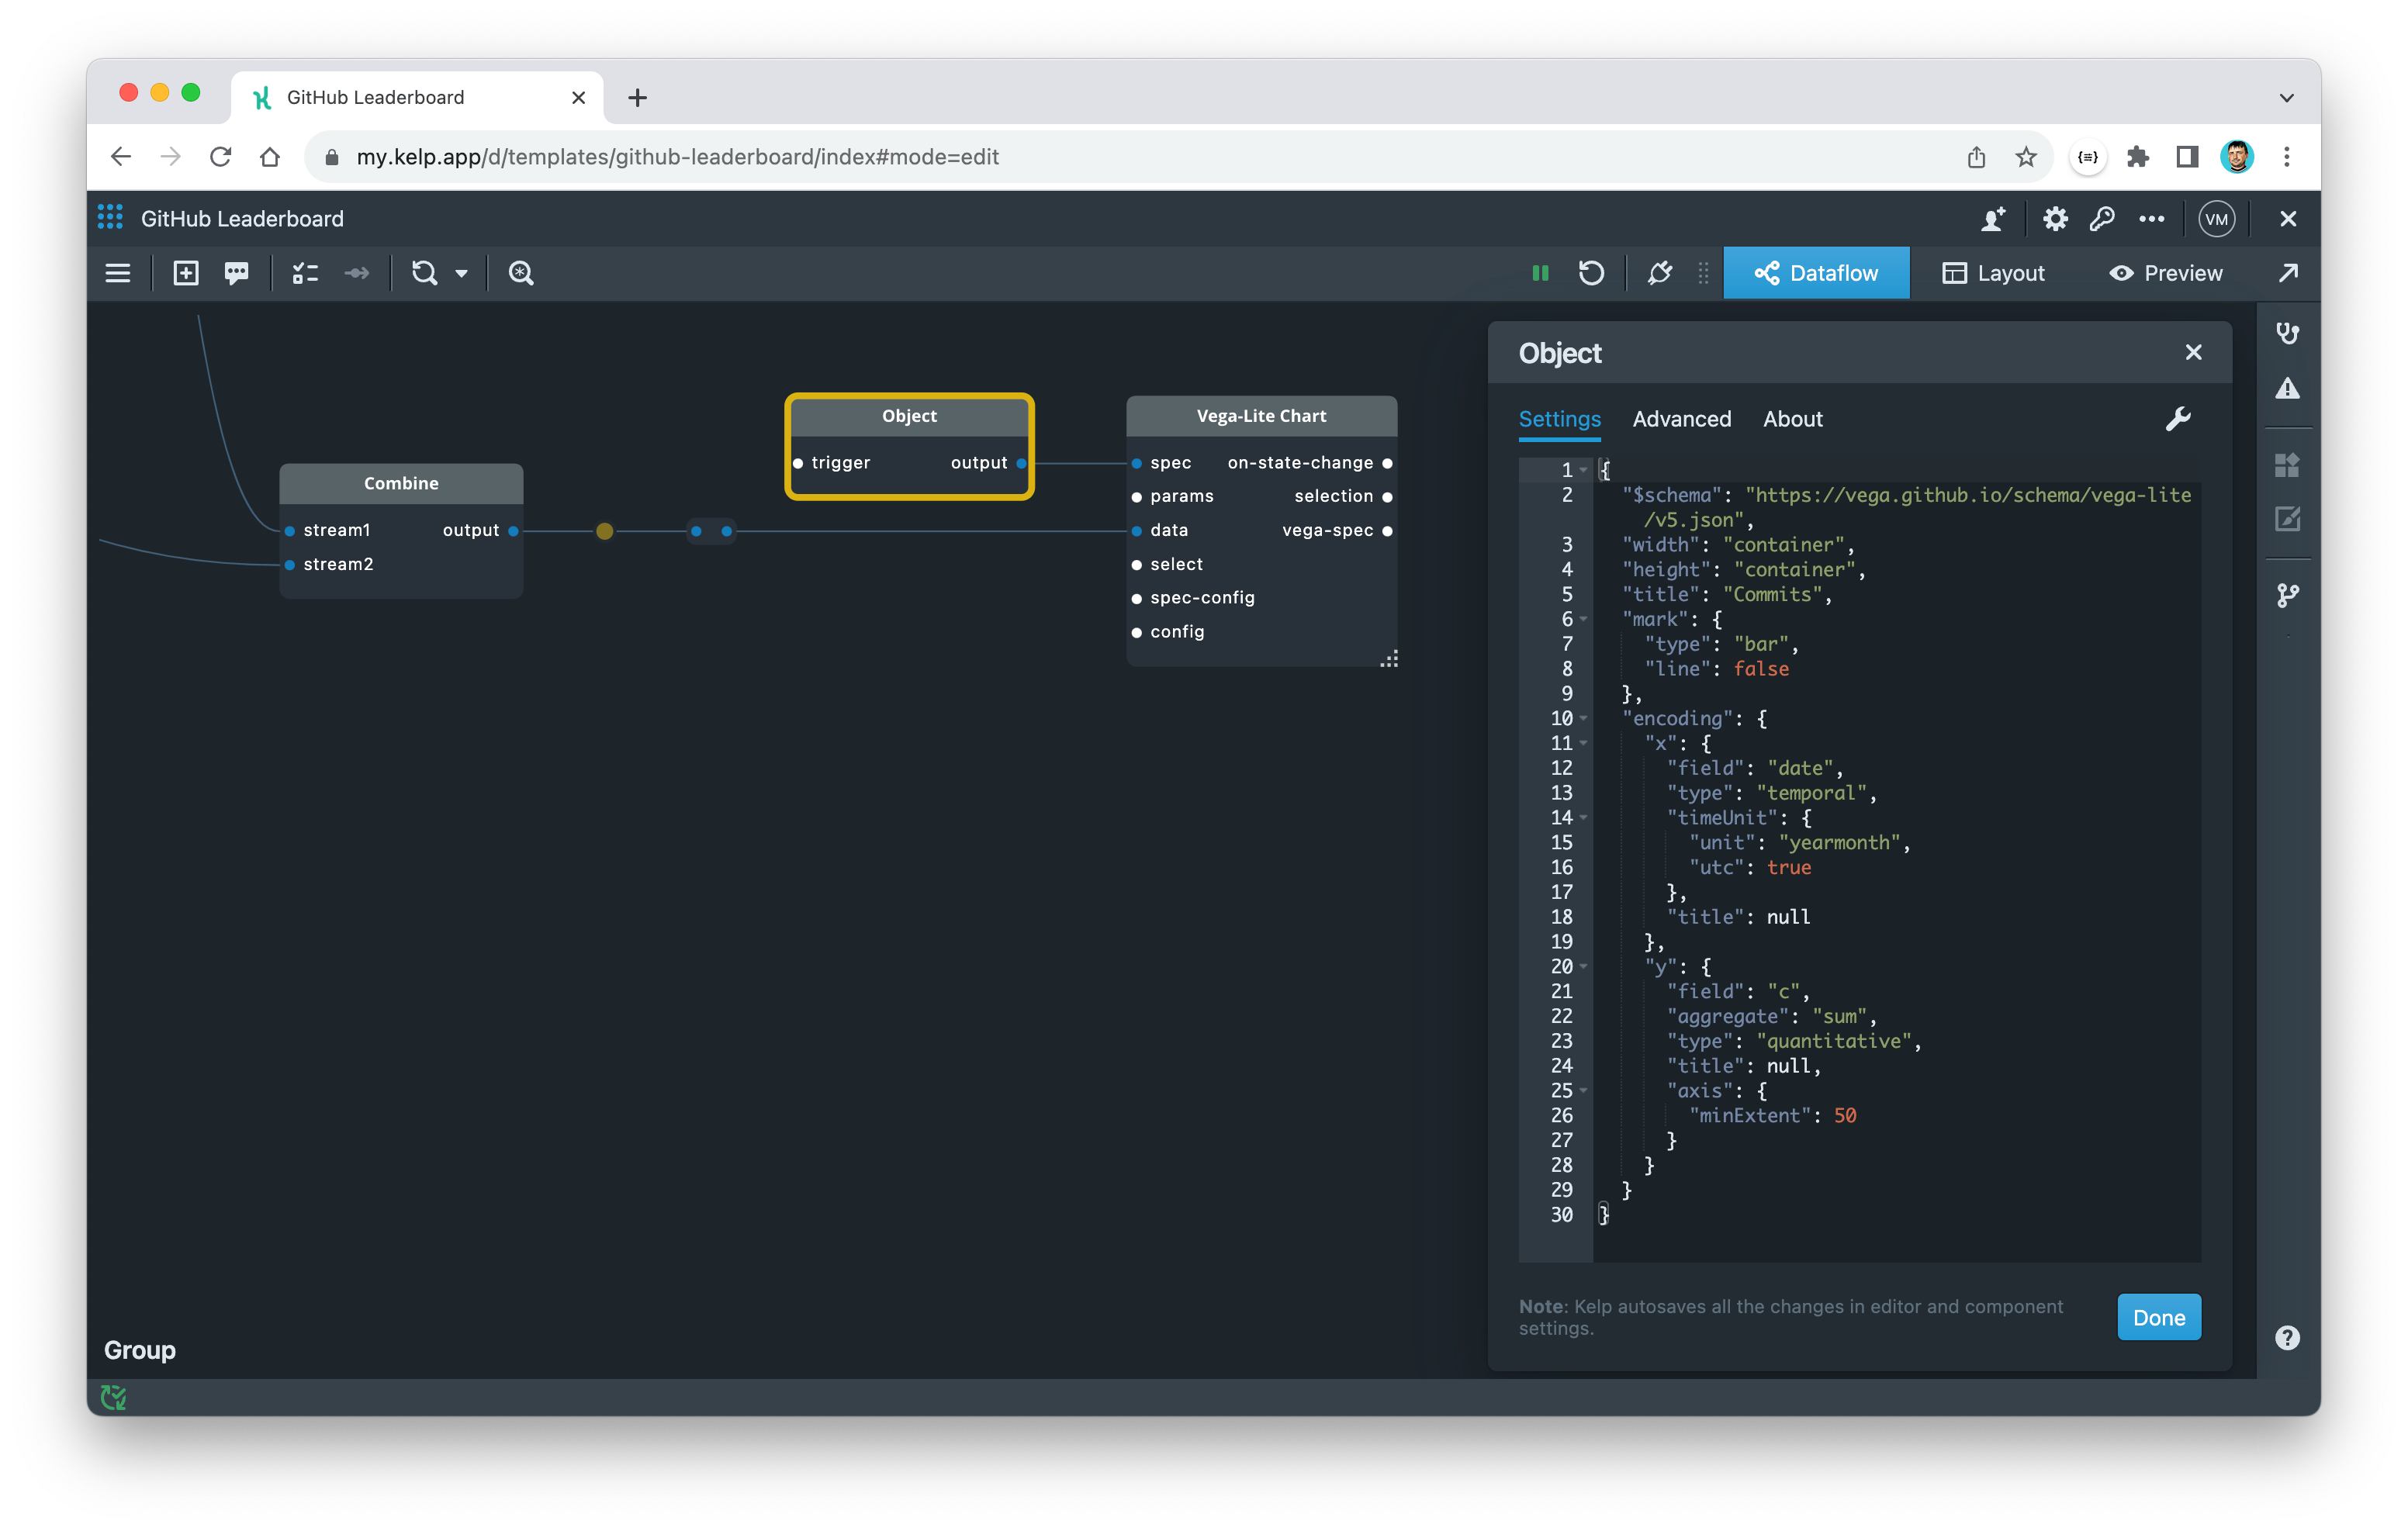
As a final step, add the Vega-Lite Chart widget for commits and specify the Vega-Lite specification:
- Add the Vega-Lite Chart widget and connect its
dataport to the transformed output from the Combine component. - Add a JSON Object constant and connect its
outputport to thespecport of the Vega-Lite Chart widget. - Open the settings dialog of the Object constant and enter the following Vega-Lite specification:
{
  "$schema": "https://vega.github.io/schema/vega-lite/v5.json",
  "width": "container",
  "height": "container",
  "title": "Commits",
  "mark": {
    "type": "bar",
    "line": false
  },
  "encoding": {
    "x": {
      "field": "date",
      "type": "temporal",
      "timeUnit": {
        "unit": "yearmonth",
        "utc": true
      },
      "title": null
    },
    "y": {
      "field": "c",
      "aggregate": "sum",
      "type": "quantitative",
      "title": null,
      "axis": {
        "minExtent": 50
      }
    }
  }
}
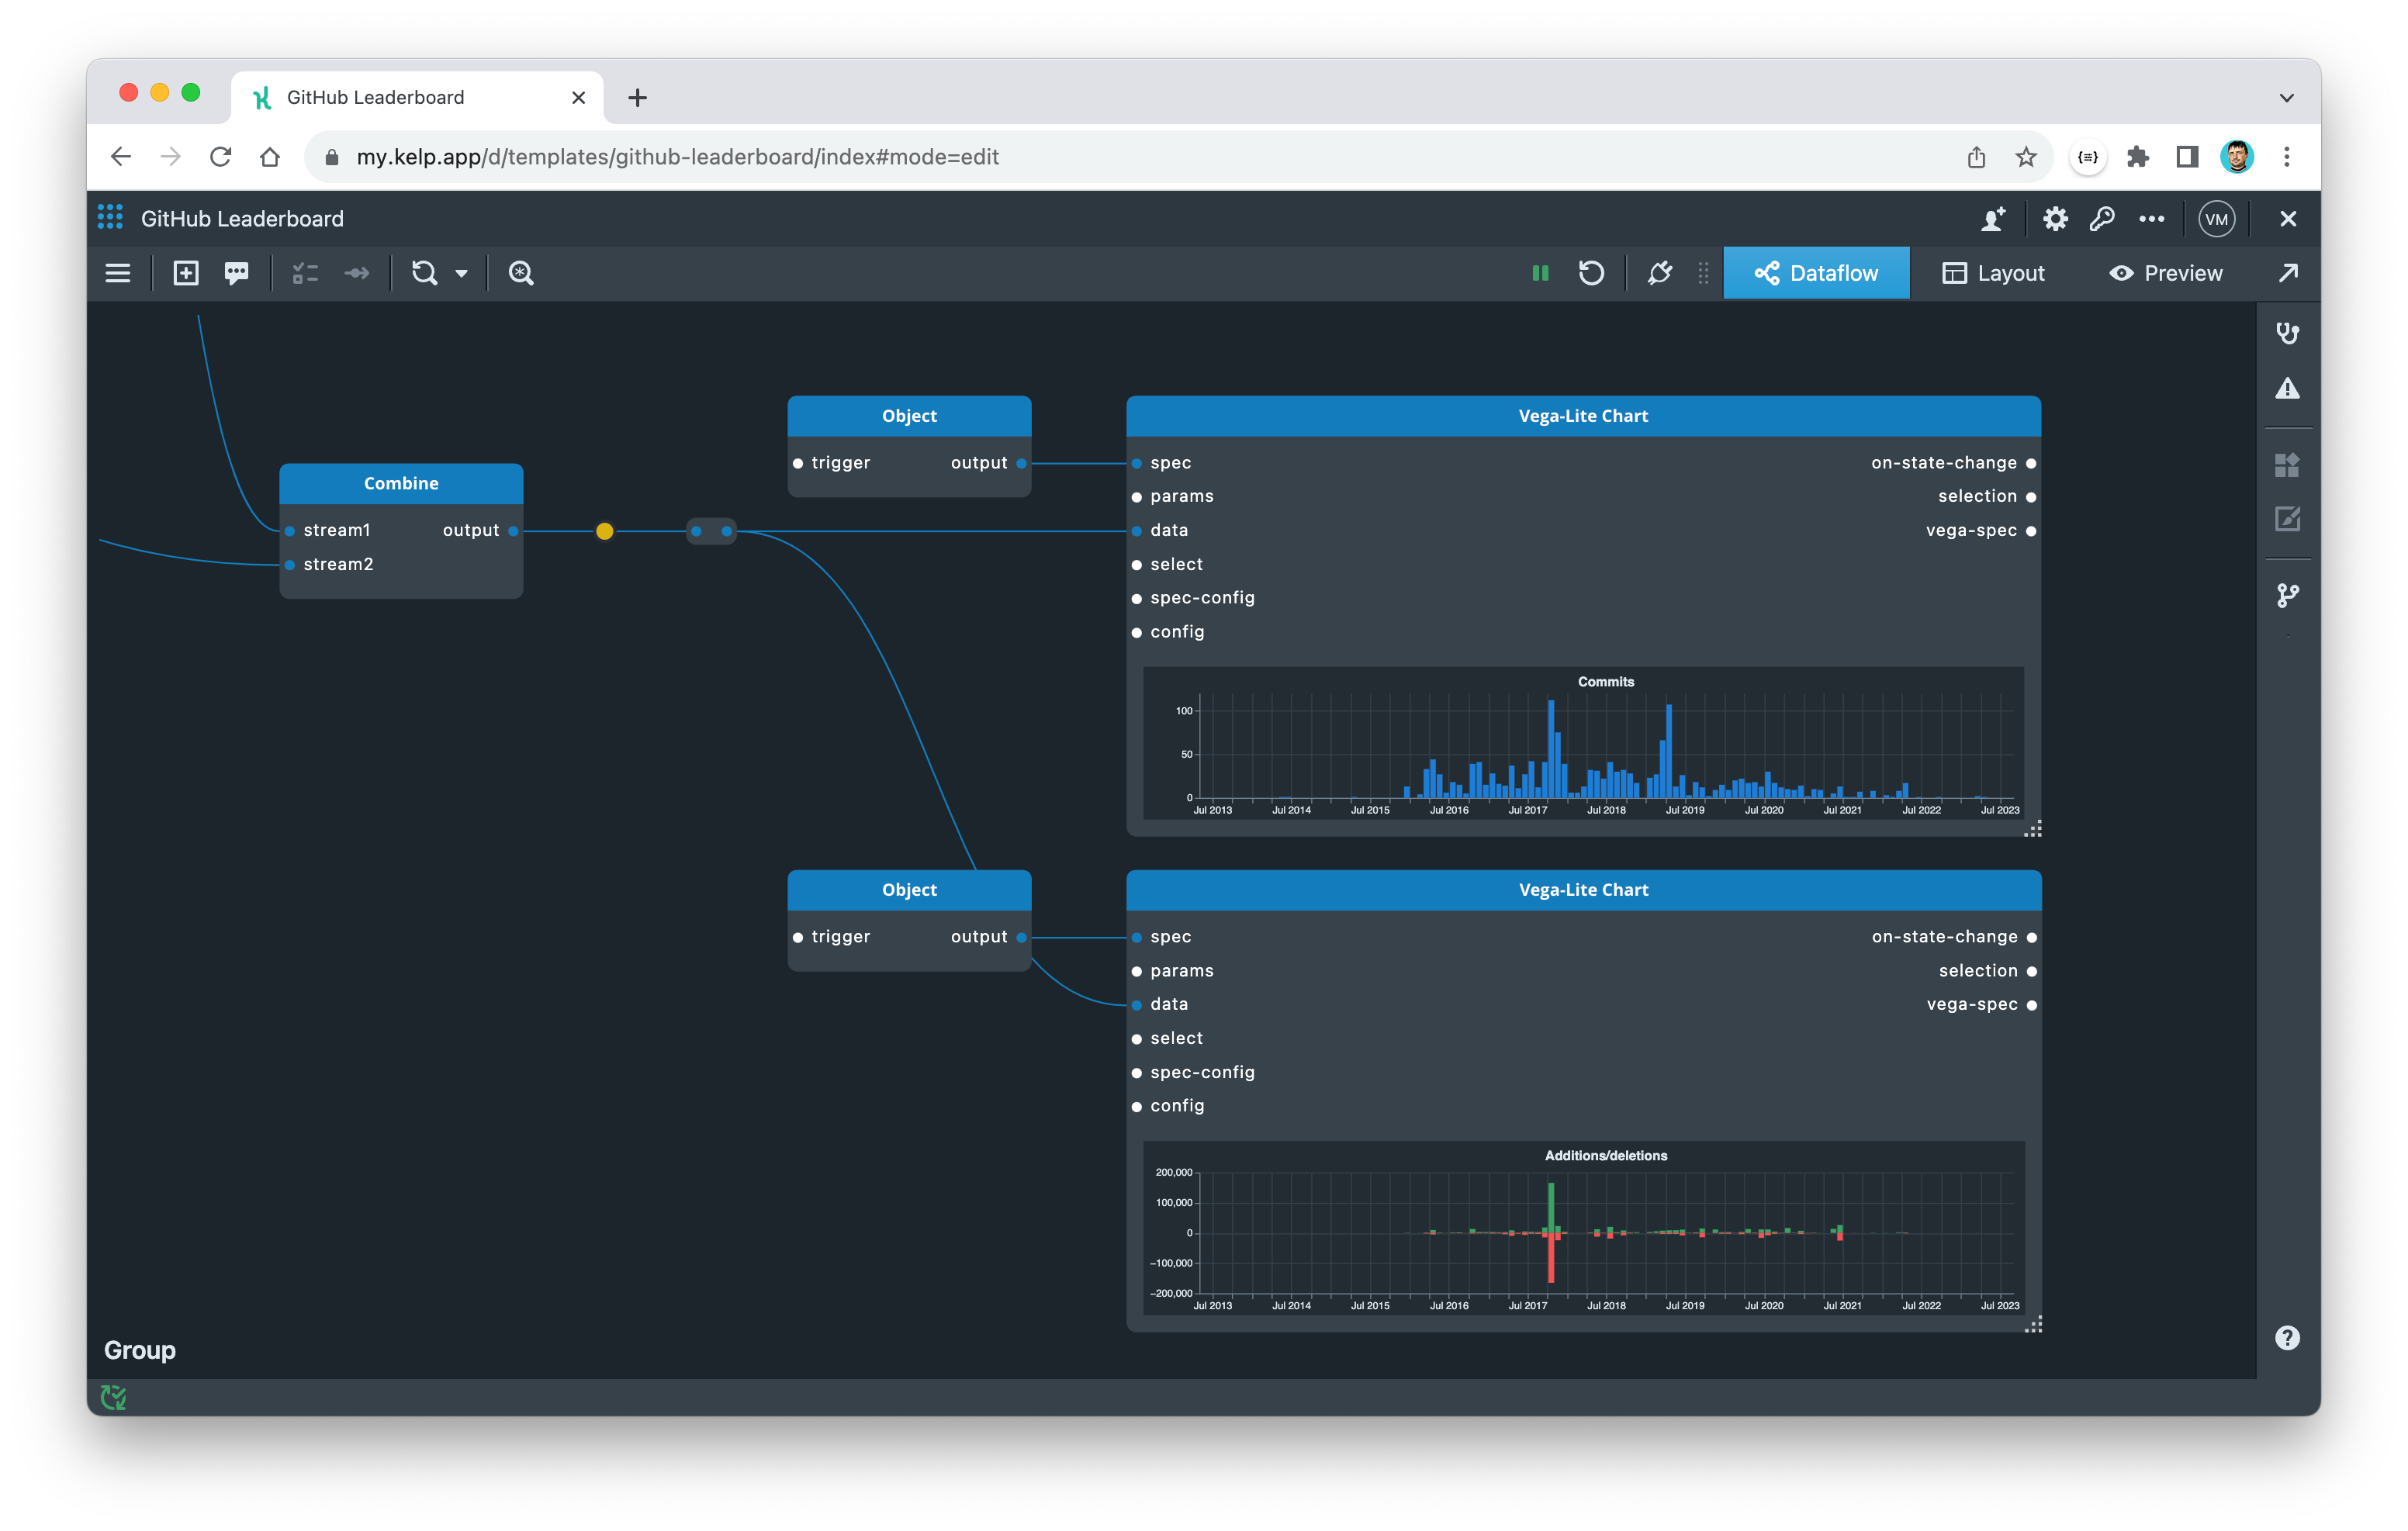
- Repeat the same steps to add a second chart for additions/deletions.
- Use the following Vega-Lite specification:
{
  "$schema": "https://vega.github.io/schema/vega-lite/v5.json",
  "width": "container",
  "height": "container",
  "title": "Additions/deletions",
  "transform": [
    {
      "calculate": "-datum.d",
      "as": "nd"
    }
  ],
  "encoding": {
    "x": {
      "field": "date",
      "type": "temporal",
      "timeUnit": {
        "unit": "yearmonth",
        "utc": true
      },
      "title": null
    }
  },
  "layer": [
    {
      "mark": {
        "type": "bar",
        "line": false,
        "color": "#3ba164"
      },
      "encoding": {
        "y": {
          "field": "a",
          "aggregate": "sum",
          "type": "quantitative",
          "title": null,
          "axis": {
            "minExtent": 50
          }
        }
      }
    },
    {
      "mark": {
        "type": "bar",
        "line": false,
        "color": "#f55353"
      },
      "encoding": {
        "y": {
          "field": "nd",
          "aggregate": "sum",
          "type": "quantitative",
          "title": null,
          "axis": {
            "minExtent": 50
          }
        }
      }
    }
  ]
}
- Expand the Vega-Lite Chart widgets
- Restart the app
Finally, update the layout of your app by adding the Vega-Lite Chart widgets that you just configured.
Enjoy! You have now built a complete GitHub Leaderboard dashboard. You can preview the app and release new version for sharing.
What's next?
- Keep learning about Kelp basics.
- Explore Kelp Playgrounds.
- Get inspired by apps and templates created by our team and community.